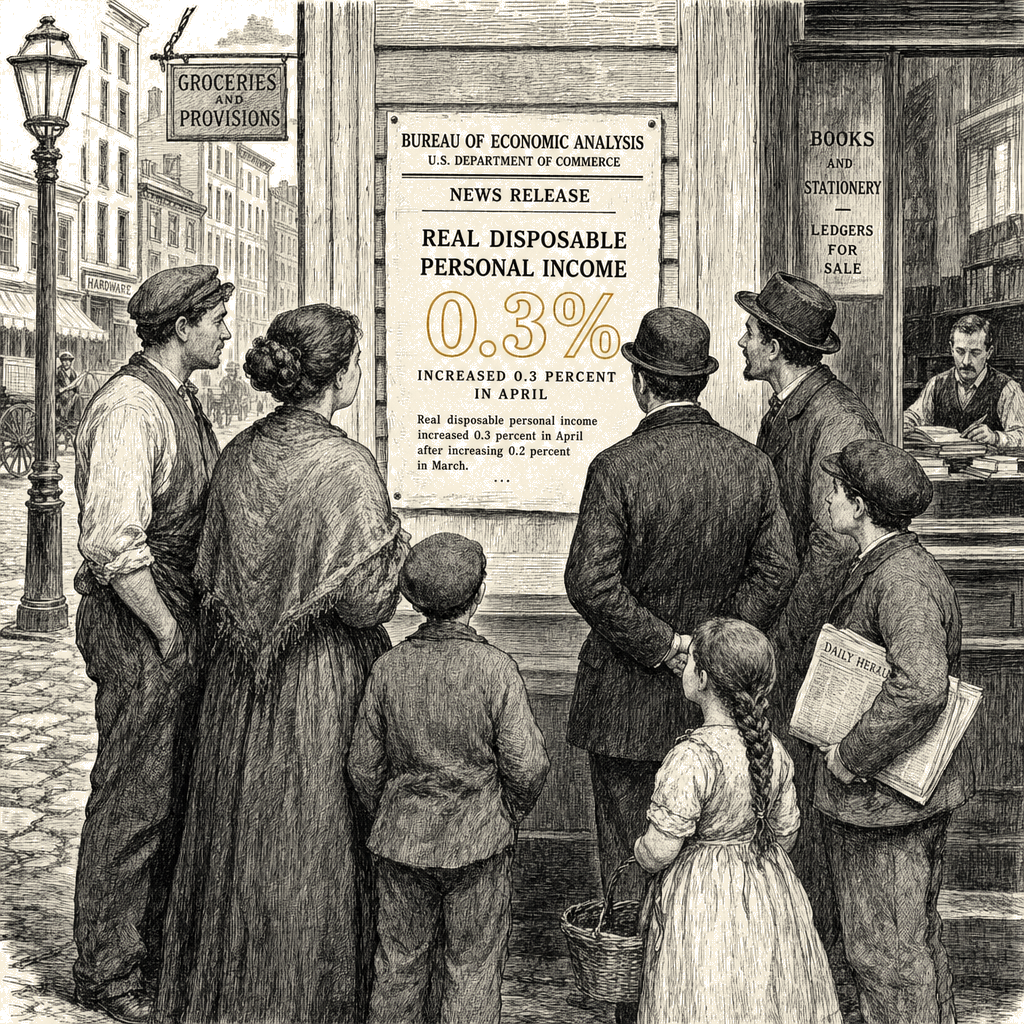
The Bureau of Economic Analysis reported Tuesday that real disposable personal income — income after taxes adjusted for inflation — rose 0.3 percent in May 2026, the latest reading in the federal government’s primary monthly gauge of household income, consumer spending, and saving. The release, issued as part of the Personal Income and Outlays series, came paired with an update from the World Inequality Lab at UC Berkeley, whose Real-Time Inequality tracker publishes monthly distributional cuts within hours of each BEA release.
The Real-Time Inequality project, directed by Thomas Blanchet, Emmanuel Saez, and Gabriel Zucman, extends the Distributional National Accounts (DINA) methodology developed in earlier Piketty-Saez-Zucman work to produce monthly and quarterly income-distribution estimates that include pretax, post-tax, and disposable income broken out by decile and by top-1 percent and top-0.1 percent shares. The methodology combines annual tax-return data with high-frequency economic series using optimal-transport statistical matching, producing the only real-time DINA-style dataset tracking income-distribution changes as they occur, according to the project.
The DINA framework addresses a gap between aggregate macroeconomic statistics and survey-based inequality measures, the latter of which the methodology’s authors say miss an estimated 30 to 40 percent of national income. The framework proceeds in three sequential steps: measuring pre-tax and post-tax national-income aggregates consistent with national accounts, adding income components missing from tax-return data, and imputing those components to households using distributional assumptions.
The Piketty-Saez-Zucman series differs from the Auten-Splinter alternative methodology on five key choices: the allocation of underreported income, treatment of retained corporate earnings, allocation of government transfers, treatment of health insurance, and the tax-unit versus household definitional choice. The cumulative effect of these choices, according to the published methodological literature, is a roughly 4.6 percentage-point increase in the top-1 percent pre-tax share since 1960 under the Auten-Splinter methodology, compared with approximately 9 percentage points under the Piketty-Saez-Zucman framework.
BEA also reports the personal saving rate in the Personal Income and Outlays release, an aggregate household-sector measure that averages across all U.S. households and masks substantial decile-level variation; saving concentrates at the top deciles, and a movement in the aggregate rate does not directly translate to a movement in median household saving. The Congressional Budget Office’s Distribution of Household Income is the most authoritative annual benchmark for these distributional cuts and serves as comparison context for the monthly BEA data.
The release comes against a backdrop of elevated inflation. The Federal Reserve’s preferred inflation gauge, the personal consumption expenditures price index, is also included in the Personal Income and Outlays release. Lower-income households have absorbed higher effective inflation than the headline rate suggests in recent readings, compounding the real-income picture captured in the personal-income series.
Main Street Independent will update this article with the specific May distributional breakdowns from Real-Time Inequality, the saving-rate composition, and the personal-consumption-expenditures price-index reading as soon as the verified data are processed.