
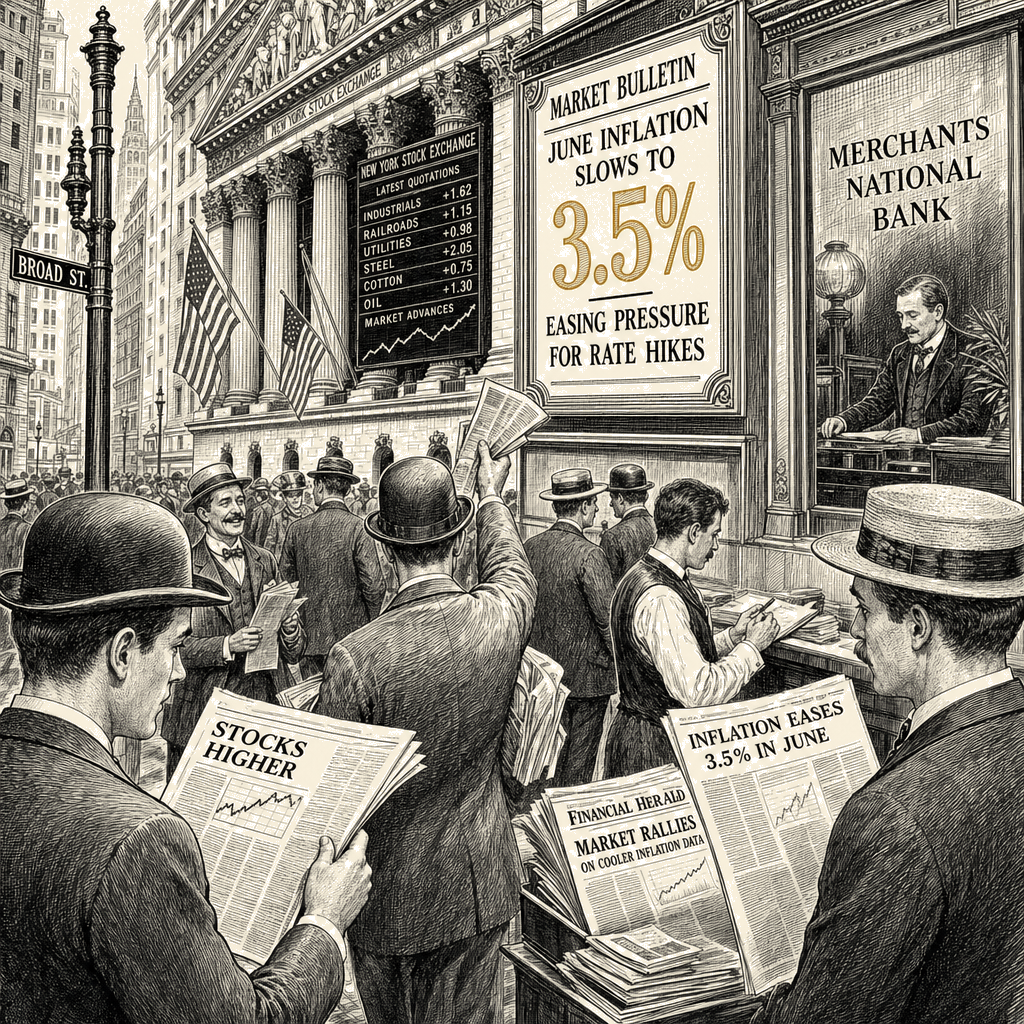
Let the market breathless coverage take its victory lap. A 3.5% CPI print, down from 4.2% — the kind of number that sends the S&P 500 up 0.4% and knocks the odds of a Fed hike from 42% to under 17% in a single day. “Inflation is moderating,” the headlines say. “The soft landing is on track.”
The soft landing is on track for the people who own the S&P 500. For everyone else, the landing surface has been concrete for years.
The soft-landing case is not a fantasy. It has a mechanism. Cooling inflation means the Fed can stop raising rates, and eventually cut them. Lower rates support asset prices — stocks, bonds, real estate — which are concentrated in the top quintile of the wealth distribution. The wealth effect from rising asset prices feeds consumer spending, which keeps GDP growing. And unemployment, at 4.1% in the most recent payroll report, remains low by historical standards. The machinery is coherent. It works for the people whose consumption is funded by portfolio returns.
The problem is that the bottom 60% of households own roughly 5% of corporate equities and mutual fund shares, per the Fed’s Distributional Financial Accounts. The wealth effect does not reach them. Their consumption is funded by wages, and wages have been running behind the cumulative price level for three years. The soft-landing mechanism is real, but it operates on an economy that most households do not inhabit. The landing is soft for the asset-owning minority. The majority is still on the ground.
Here is what the inflation number actually measures. The CPI basket is a fixed-weight index of household consumption — rent, food, gasoline, medical care, car insurance, all the things a family has to buy regardless of what the Nasdaq does. When the headline rate drops from 4.2% to 3.5%, the median household is paying 3.5% more than it did last June for the same stuff. That is additive to the 9.1% peak in June 2022. Cumulative price level since the pandemic trough: the CPI-U has risen roughly 22% from the April 2020 low to the June 2026 reading. The index does not compound the way a bond does, but the arithmetic of cumulative cost burden works on the same principle.
The Federal Reserve spent the better part of two years raising rates at the fastest clip since the early 1980s to squeeze exactly this inflation out of the system. It worked, in the narrow sense the bond market cares about. The case for another hike now recedes. Good news for a Treasury holder; the yield on the two-year note fell 12 basis points on the data. But the mechanism by which rate hikes suppress inflation — higher borrowing costs → less consumption → slower price growth — also suppresses wage growth, construction, durable-goods purchases, and small-business inventory investment. The working family that is still paying 22% more for groceries than it did four years ago is not made whole by a 0.4% equity bounce.
The two groups read the same CPI number and draw opposite conclusions from it. The bond market reads “less pressure to tighten” and rallies. The household reading the same headline sees “still higher than the Fed’s target, still eating up the raise I got last year.” Both are correct interpretations of the same data. The difference is structural: one group owns assets that respond instantly to rate expectations; the other group lives inside the economy that rate expectations are supposed to manage.
The oil price is the part of the CPI story the bond market is ignoring
Oil prices are climbing on U.S.-Iran war worries, and the bond market’s models treat supply shocks as transients — deviations from trend, assumed to reverse. The word “shock” in the macro models means exactly that: a temporary spike, not a structural shift. The models are built to look through it.
Gas-station arithmetic does not look through anything. It charges the price on the pump. When crude rises on Hormuz-closure fears, the median household pays the higher gasoline price for the six weeks the shock is on, and the six weeks after that, and however long the market takes to decide the Strait is safe. The bond market’s transient is the household’s monthly budget.
The distributional dimension is straightforward. Energy costs are regressive — they consume a larger share of income for lower-income households. The CPI print’s headline moderation is driven partly by components that are not energy, and the energy component that is still rising is the one that hits the bottom half of the distribution hardest. The same CPI report that tells the bond market to stop worrying about rate hikes is telling the median household to keep worrying about the cost of getting to work.
The link between oil prices and the broader inflation outlook is not theoretical. The last time the U.S. and Iran approached a military confrontation — the post-Soleimani period in early 2020 — crude spiked and retreated within weeks. The difference in 2026 is that the conflict is not a single strike but a sustained escalation, and the market is pricing in the possibility that the Strait of Hormuz, through which roughly a fifth of global oil supply transits, becomes a chokepoint. The Fed’s models can treat that as a tail risk. A household filling a 15-gallon tank cannot.
The consumer-sentiment surveys in the publication’s coverage going back to May 2026 show households reporting record discouragement even as the equity market closed out a run of eight straight winning weeks. That is not a paradox. It is the same phenomenon at two different positions in the distribution. The stock market prices off the expected earnings of S&P 500 companies, which have pricing power, supply-chain leverage, and — thanks to the share-repurchase boom enabled by Rule 10b-18’s safe harbor and turbocharged by post-2017 TCJA repatriation, low funding costs, and EPS-management incentives — the capacity to deliver per-share earnings growth even when revenue is flat. Households price off their own rent, gas, and grocery receipts. The two indicators diverge because the economy the index measures is not the economy households live in.
And the larger fiscal architecture is built on the assumption that the income side of the ledger — the revenue side — will continue to underperform relative to the economy because the 2017 TCJA individual-rate cuts, extended through the current reconciliation vehicle, channel the bulk of their benefit to the top quintile. Distributional analyses from the Tax Foundation confirm the top quintile captures the largest share of the after-tax income gain from a permanent extension. The JCT scored the extension against a current-law baseline. The current-policy baseline — the one that assumes the cuts are already permanent and therefore “cost nothing to extend” — is the gimmick that produces the zero-revenue-loss claim. The same claim was made for EGTRRA in 2001. The same claim was made for TCJA in 2017. The same pattern of static-cost underestimation and dynamic-feedback overestimation repeats.
The question for the Fed is whether the 3.5% CPI print is enough to halt a tightening cycle that was already running on momentum rather than data. The July FOMC minutes will show the internal debate. But the distributional effect is already locked in: lower rates support asset prices, which are concentrated at the top; lower inflation helps the broad population, but only marginally so long as the cumulative price level sits at a permanently elevated plateau relative to wages that have not caught up.
Last quarter’s average hourly earnings data, from BLS, showed real average hourly earnings essentially flat — down 0.1% by one BLS measure, up 0.1% by another — over the trailing twelve months. Flat is not “made whole.” And the payroll data, released the first Friday of each month, shows the composition of job growth continuing to tilt toward the low-wage services sector — hospitality, retail, home health — while high-wage white-collar sectors shrink or hold flat.
The CPI print is good news if you measure the economy by the value of a portfolio. It is corrective but incomplete news if you measure it by the lived experience of the median household. The two readings will converge only when the policy levers that produce the divergence are addressed. The Fed controls one set of those levers: the short-term rate. The fiscal authorities — the president and the Congress who are currently using reconciliation to extend the TCJA cuts without paying for them — control the other. The Fed has been doing the work of stabilization alone since 2021. The fiscal side has been doing the opposite.
The numbers are in the baseline. The CBO’s June 2026 Monthly Budget Review reported the deficit at $1.4 trillion through the first three quarters of the fiscal year, on a current-law baseline that assumes the TCJA individual provisions expire at the end of 2025. If the reconciliation bill under consideration makes them permanent, CBO has already scored a full TCJA extension at roughly $4 trillion in additional primary deficits over the ten-year window. The JCT scoring memo on that question is already in the vault. The score is the score. The author of the bill does not get to grade it.