Summary
- The Bureau of Economic Analysis aggregate personal income release masks substantial decile-level variation that the World Inequality Lab addresses through monthly distributional estimates.
- The Piketty-Saez-Zucman and Auten-Splinter methodological frameworks produce divergent top-1 percent pre-tax share measurements due to documented differences in allocating underreported income and retained corporate earnings.
- The Congressional Budget Office maintains the authoritative annual benchmark for household income distribution while formal federal policy models remain constrained by unresolved methodological disputes over high-frequency data.
- Lower-income households absorbing higher effective inflation compounds the analytical friction between aggregate national accounts and real-time distributional visibility.
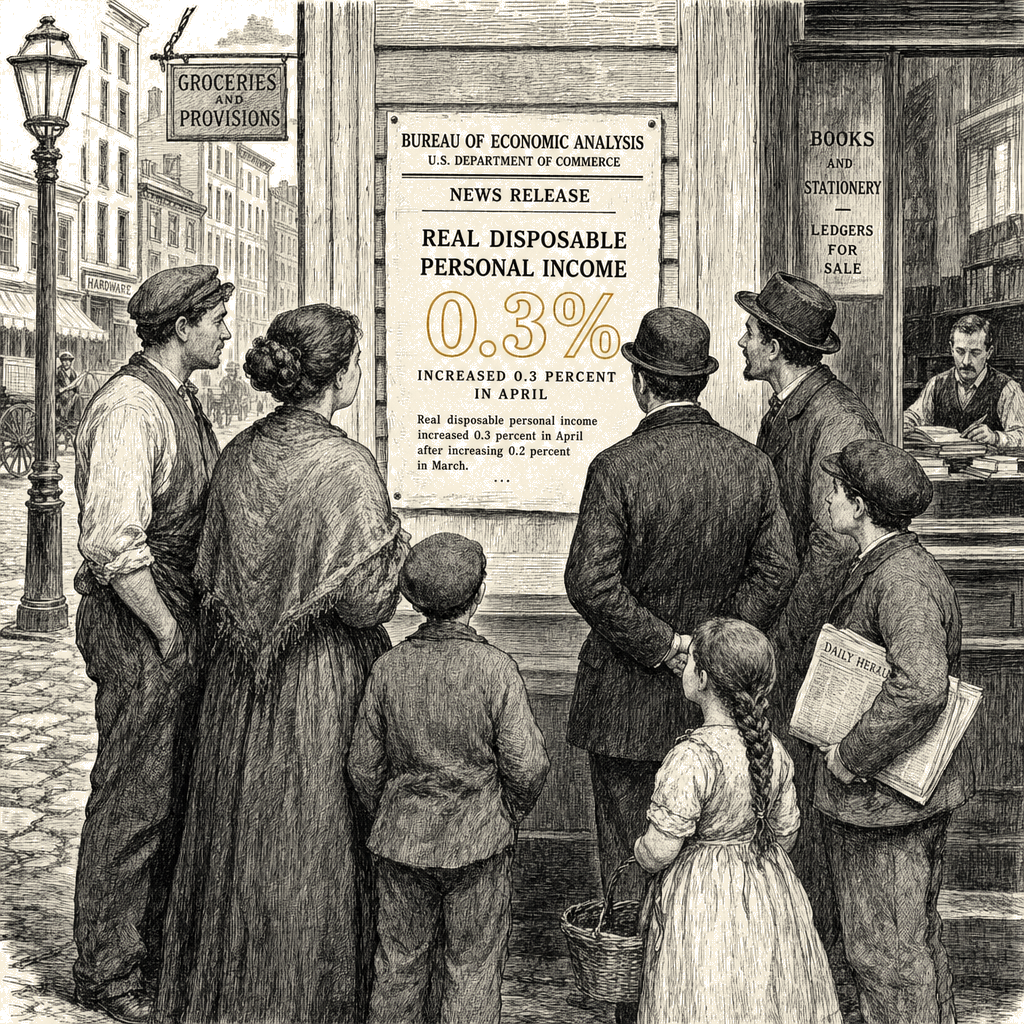
The Bureau of Economic Analysis reported a 0.3 percent May 2026 rise in real disposable personal income, releasing the verified aggregate household-sector data alongside pending distributional and inflation-incidence components that highlight the structural friction between national accounting and real-time inequality measurement. The concurrent publication of the World Inequality Lab’s Real-Time Inequality tracker updates demonstrates that U.S. economic measurement currently operates across two parallel tracks — aggregate national accounts produced on a monthly federal cycle and high-frequency distributional estimates reliant on contested methodological assumptions — with formal policy integration constrained by the unresolved empirical divergence between competing distributional frameworks.
The measurement environment
The Bureau of Economic Analysis Personal Income and Outlays release serves as the primary monthly U.S. household-sector data product, providing the verified 0.3 percent May 2026 rise in real disposable personal income. The May 2026 saving-rate composition, the personal-consumption-expenditures price-index reading, and the Real-Time Inequality distributional breakdowns remain flagged as pending verification per the source publication’s stated update schedule, meaning the aggregate May figure is verified while the distributional and inflation-incidence components await secondary processing.
The only real-time Distributional National Accounts-style distributional cuts originate from the World Inequality Lab at UC Berkeley, directed by Thomas Blanchet, Emmanuel Saez, and Gabriel Zucman. The Congressional Budget Office’s Distribution of Household Income functions as the most authoritative annual benchmark for these distributional cuts, serving as the necessary comparison context and annual reconciling layer between aggregate Bureau of Economic Analysis measures and survey-based inequality estimates.
The institutional mandates of these bodies operate in parallel: the Bureau of Economic Analysis produces the primary monthly gauge of household income, consumer spending, and saving for policy and forecasting use; the World Inequality Lab extends distributional measurement to the monthly frequency at which the aggregate data already move; and the Congressional Budget Office produces the annual reconciling layer. The concurrent June 30 release documents a measurement environment in which aggregate national accounts that mask decile-level variation coexist with high-frequency distributional estimates that rely on contested methodological assumptions.
Methodological disputes and empirical divergence
The Real-Time Inequality methodology extends the Distributional National Accounts framework developed in earlier Piketty-Saez-Zucman work to produce monthly and quarterly income-distribution estimates. The methodology combines annual tax-return data with high-frequency economic series using optimal-transport statistical matching, a mechanism that addresses the latency problem inherent in annual tax data to produce monthly distribution estimates. The framework’s authors characterize survey-based inequality measures as missing “an estimated 30 to 40 percent of national income.”
The framework proceeds in three sequential steps: measuring pre-tax and post-tax national-income aggregates consistent with national accounts; adding income components missing from tax-return data; and imputing those components to households using distributional assumptions.
The Piketty-Saez-Zucman series differs from the Auten-Splinter alternative methodology, developed by George Auten and James Splinter, on five documented choices: the allocation of underreported income; the treatment of retained corporate earnings; the allocation of government transfers; the treatment of health insurance; and the tax-unit versus household definitional choice. The published methodological literature documents that the cumulative effect of these choices is a “roughly 4.6 percentage-point increase in the top-1 percent pre-tax share since 1960” under the Auten-Splinter methodology, compared with “approximately 9 percentage points” under the Piketty-Saez-Zucman framework.
The published methodological literature presents this as an empirical divergence between the two frameworks rather than a normative dispute. The divergence in measured top-share trends is a direct mathematical consequence of the respective allocation rules for underreported income and retained corporate earnings, making the question of which income components accrue to which households a documented empirical matter. The cumulative effect of the five key choices separating the frameworks means that distributional estimates are inherently model-dependent, and while the magnitude figures may vary by base year, income definition, and methodology vintage, the divergence direction is well-corroborated even as the specific magnitudes remain interpretation-dependent.
Inflation incidence and saving-rate variation
The aggregate personal saving rate reported in the Personal Income and Outlays release is an average across all U.S. households that “masks substantial decile-level variation, with saving concentrated at the top deciles,” a top-decile saving concentration documented in the Congressional Budget Office’s annual Distribution of Household Income. Consequently, a movement in the aggregate saving rate does not directly translate to a movement in median household saving.
The personal consumption expenditures price index, included in the same release and serving as the Federal Reserve’s preferred inflation gauge, captures aggregate inflation. However, “lower-income households have absorbed higher effective inflation than the headline rate suggests” in recent readings, compounding the real-income picture captured in the personal-income series. The interaction between this inflation incidence and the real-income figure is one of the variables flagged as awaiting verified data. The current macroeconomic environment, characterized by divergent effective inflation rates across income deciles, increases the demand for distributional visibility, while the methodological contestability acts as a friction factor against that demand.
Institutional adoption and future integration
The integration of high-frequency Distributional National Accounts-style estimates into formal policy inputs depends on the resolution of the gap between technical availability and institutional adoption. Neither the Federal Open Market Committee’s published inflation framework nor the Congressional Budget Office’s annual Distribution of Household Income currently cites monthly distributional cuts as a primary input, and formal incorporation of monthly distributional estimates into primary forecasting models remains constrained by unresolved methodological disputes over retained earnings and underreported income.
Historical precedent indicates that methodological differences can persist for decades, with each framework serving distinct analytical purposes and institutional mandates. The Federal Reserve’s shift from headline Consumer Price Index to core personal consumption expenditures — informal around 2000 and an official inflation target in 2012 — was driven by the central bank’s stated operational preference for a measure that captures changing consumer behavior and broader expenditure weights.
Observable indicators for future integration of monthly distributional data include explicit citation of Real-Time Inequality distributional cuts in Federal Open Market Committee meeting documents or the Summary of Economic Projections, as well as formal reconciliation between the Congressional Budget Office’s annual benchmarks and the monthly releases. The May 2026 real-income print is the verified input, but its distributional and inflation context remains to be processed.
Framing of the data infrastructure
The source article’s primary frame centers on data infrastructure, pairing the verified 0.3 percent aggregate May figure with documentation of the institutions and methodologies required to translate it into household-level claims. The methodological dispute between the Piketty-Saez-Zucman and Auten-Splinter frameworks is framed as a documented empirical divergence rather than a normative dispute, with both sets of authors named under symmetric attribution discipline.
The institutional adoption question is framed as contingent on observable future events, specifically citation and reconciliation, rather than as an open-ended projection. The pending status of the May 2026 decile-level breakdowns, saving-rate composition, and personal consumption expenditures price-index reading is preserved as a documentary status, representing a scheduled processing step rather than an absence of data.
Analytical techniques used in this piece
This analysis applies the methods below. Each links to a short, plain-English explainer you can read and reuse.
- Interest Mapping
- Separates parties’ stated positions from their underlying interests (Fisher & Ury).
- Probabilistic Forecasting
- Puts calibrated probabilities on what happens next.
- Quick Orientation
- A fast lay-of-the-land read of an unfamiliar domain.