Summary
- Lauren Lowman frames the July 4, 2026 wildfire risk as a convergence of heat-loaded fuels, a single-day spike in consumer fireworks ignitions, and a structurally exposed wildland-urban interface.
- Drought and heat-wave conditions desiccate vegetation and lower ignition thresholds, creating a climatic multiplier for any spark.
- The July 4 holiday produces a discrete behavioral ignition pressure, accounting for roughly 15,000 fires nationwide between 1992 and 2020.
- Structural exposure in the wildland-urban interface converts wildland ignitions into structure-loss events, with humans starting 97 percent of fires threatening homes in these areas from 1992 to 2015.
Lauren Lowman, an associate professor of civil and environmental engineering at Wake Forest University, characterizes the July 4, 2026 wildfire risk as the convergence of three compounding pressures: a heat- and drought-loaded fuel bed, a single-day spike in human ignition attempts from consumer fireworks, and a wildland-urban interface footprint that places homes adjacent to wildland fuels, according to an analysis published in The Conversation and republished by United Press International. The 2026 holiday carries additional symbolic weight as the nation marks the 250th anniversary of independence, but the physical risk is driven by the first half of 2026 already recording more wildfires than the same period in any of the previous 10 years, alongside extreme or exceptional drought across large parts of the West and Great Plains.
Climatic and Behavioral Causal Mechanism
Lowman’s analysis separates the elevated July 4, 2026 risk into three interacting variables: climatic preconditioning, behavioral ignition pressure, and structural exposure. Recurring drought and heat-wave conditions have desiccated fuels and lowered ignition thresholds, forming a climatic multiplier where any spark is more likely to escape. Data cited by Lowman indicate that 42 percent of all land burned in the western U.S. from 2001 to 2024 happened during or right after a heat wave, tightly correlating heat-wave timing with the largest burned-area episodes. The national wildfire forecast shows above-normal fire risk continuing into July in much of the U.S. West and Texas, with above-normal heat and dryness through early July in large parts of the West and Southeast.
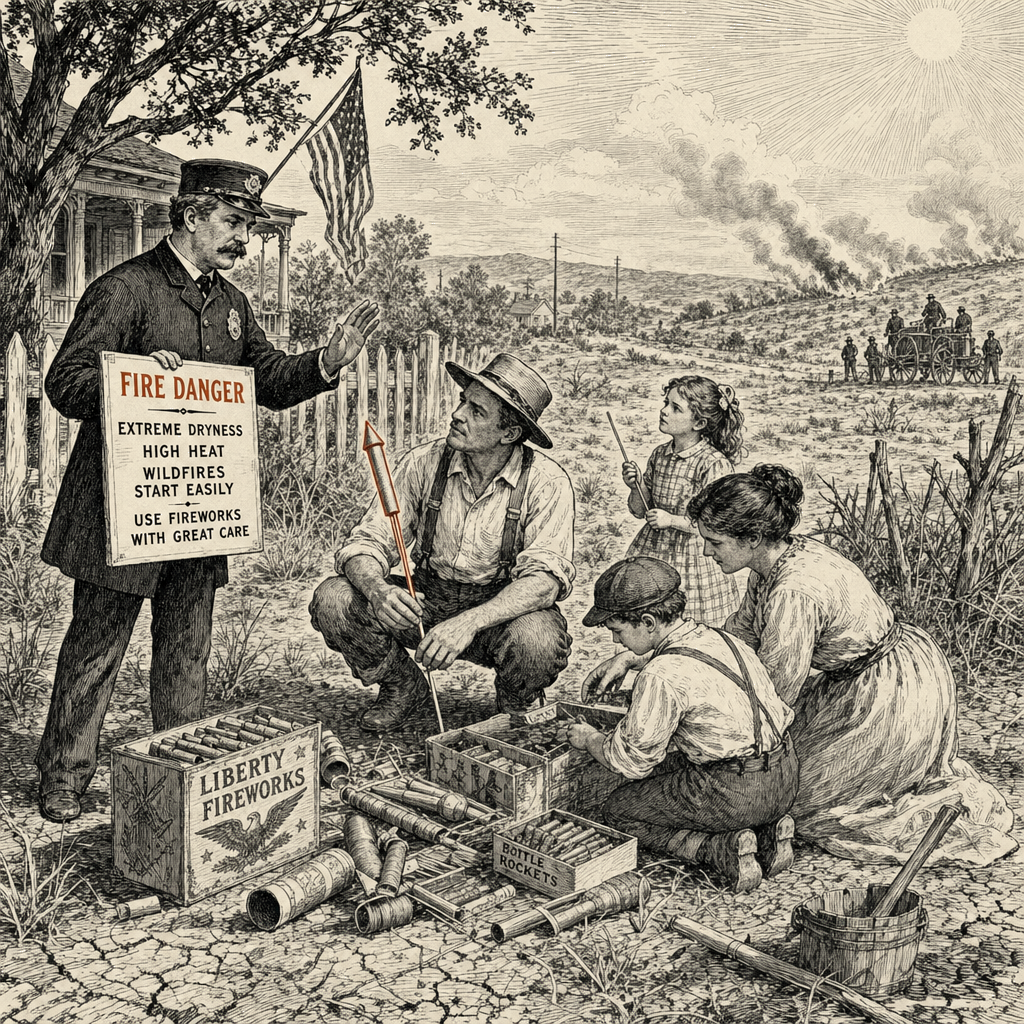
Layered over this climatic baseline is a discrete behavioral ignition pressure. Fireworks ignited an estimated 32,000 fires in the U.S. in 2023, and the concentration of consumer fireworks activity on July 4 produces a specific spike in ignition attempts. From 1992 to 2020, roughly 15,000 fires were ignited nationwide on that date. Even in the eastern U.S., where July falls outside the peak fire season, Independence Day sees about 400 more fires than other days that month. “Fireworks, from bottle rockets to Roman candles, start a lot of fires in the U.S. every year,” Lowman wrote. As she noted regarding the environmental conditions, “In hot, dry conditions it doesn’t take much to start a fire. Dry vegetation — trees, shrubs and grasses — provides the fuel. A windy day can substantially raise the risk of a runaway fire.”
The reconstructed causal chain positions drought and heat-wave conditions as the multiplier, July 4 ignition pressure as the trigger, and wildland-urban interface exposure as the determinant of what is at stake when the trigger pulls. However, a precise nationwide causal attribution of July 4 fires specifically distinguishing fireworks from other concurrent human ignition sources, such as debris burning or campfires, remains absent from the cited data. Without this precise attribution, the available evidence cannot directly adjudicate between the climatic and behavioral hypotheses in a clean counterfactual sense.
Root-Cause Layering and Regulatory Unevenness
The causal architecture operates across multiple time horizons. The proximate cause consists of fireworks ignitions on a dry day; removing that single night of consumer activity would not eliminate the seasonal risk, as humans ignited wildland-urban interface fires throughout the fire season between 1992 and 2015, but it would remove the largest single-day ignition spike on the calendar. Sub-causes include the long-horizon recurring drought and heat-wave conditions, which are responsive only to long-term policy, and the short-horizon, controllable variable of uneven regulatory coverage of consumer fireworks.
State legislators hold the power to enact bans, with urgency fluctuating inversely with current fire conditions. Utah officials banned personal fireworks statewide ahead of the 2026 holiday while battling multiple large wildfires, including the Cottonwood fire, which burned tens of thousands of acres. This preemptive ban contrasts with other drought-affected states that have not enacted similar restrictions, creating a jurisdictional unevenness that determines whether the ignition spike is suppressed in a given county or merely displaced across the border. Beneath the regulatory sub-cause lies the structural layer of wildland-urban interface exposure. Because humans started 97 percent of fires that threatened homes in wildland-urban interface areas from 1992 to 2015, this exposure converts a wildland fire into a structure-loss event. The deepest root is the convergence of these three slow-moving variables: recurring drought and heat-wave conditions, a structurally exposed landscape, and a holiday that historically distributes ignition sources into dry landscapes on a single date.
Stakeholder Alignment and Structural Exposure
The risk distribution implicates distinct stakeholder classes with varying leverage and exposure. The U.S. Forest Service, Bureau of Land Management, and the National Interagency Fire Center bear the suppression load and publish the fire-potential outlooks informing the risk assessments. Their concrete interest is reducing ignition attempts during high-risk windows; their best alternative if July 4 produces a major escape is relying on mutual-aid compacts and post-incident recovery, both carrying budgetary and political costs.
Public-safety advocacy organizations, notably the National Fire Protection Association, treat the holiday as a recurring injury and ignition event. The association’s concrete interest is shifting consumer behavior toward professional displays, utilizing messaging and standards rather than direct regulation. Local emergency rooms and trauma systems absorb the corresponding injury load, with emergency rooms treating roughly 9,700 fireworks-related injuries in 2023, a third of them involving children. The association encourages the public to leave pyrotechnics to professionals, noting that “public displays are cheaper for you, safer for everyone, and often far more spectacular.” Municipalities and professional-display operators hold an offsetting stake, positioned as preferable alternatives to consumer fireworks.
The consumer fireworks industry holds a concentrated revenue stake in the July 4 retail window. The variable state-level action on personal fireworks in 2026 suggests that retailers’ most plausible alternative to a uniform ban is self-regulation and location-based restrictions short of a statewide prohibition, though the data do not specify federal preemption status.
Exposure-bearing parties face direct loss exposure. Wildland-urban interface homeowners possess high legitimacy and urgency regarding property protection but low direct power to alter regional fuel conditions. Populations in the Great Plains and West face compound exposure from documented drought and wildfire response in Oklahoma, Nebraska, and Utah in June 2026, which forced entire communities to evacuate. Tribal communities adjacent to federal land sit within the suppression footprint of federal agencies and depend on their pre-positioned resources. Downstream communities and ecosystems face plausible but unquantified smoke drift and water-quality effects during active wildfire episodes, representing an absent but affected stakeholder class in local fireworks regulations.
Forward Consequences and Diagnostic Uncertainties
Several forward-looking consequences emerge from the current trajectory. If the National Interagency Fire Center’s above-normal fire-potential outlook for July holds, suppression resources in the West and Texas are likely to be drawn down before the holiday peak, narrowing the response window for any escape on July 4 itself. If the first-half 2026 wildfire record holds, the season will set a new baseline against which future July 4 risk is measured, regardless of the holiday-specific ignition spike. If Utah’s preemptive ban suppresses personal fireworks ignitions within its borders, the unresolved question is whether displaced activity moves to neighboring states with weaker restrictions or converts to professional-display attendance.
Lowman’s framing positions the July 4 risk as a compound structure of environmental preconditioning, behavioral concentration, and structural exposure, rather than a single-cause failure. Her analytic posture is descriptive, citing National Fire Protection Association data, observational wildfire counts, and the 97 percent wildland-urban interface figure rather than presenting a novel study. The original headline framing leads with the climatic and behavioral legs, with the structural wildland-urban interface leg embedded in the body text.
Several uncertainties remain unresolved in the available data. Whether a state-level fireworks ban displaces ignition activity across jurisdictional lines is not empirically tested. The documented drought footprint in Oklahoma, Nebraska, and Utah does not directly quantify agricultural impacts. Industry revenue concentration, self-regulation posture, and federal preemption status remain analytical inferences drawn from the evidence of variable state-level action. Downstream smoke drift and water-quality effects are plausible but not directly documented. The diagnostic attribution gap, which would precisely separate July 4 fireworks ignitions from other concurrent human ignition sources nationwide, remains open.
Analytical techniques used in this piece
This analysis applies the methods below. Each links to a short, plain-English explainer you can read and reuse.
- Process Tracing
- Reconstructs the step-by-step causal pathway of a specific historical event.
- Root-Cause Analysis
- Traces a symptom back along its causal chain to the conditions that actually generated it.
- Stakeholder Mapping
- Charts the parties to a situation — their interests, power, and alignments.