Summary
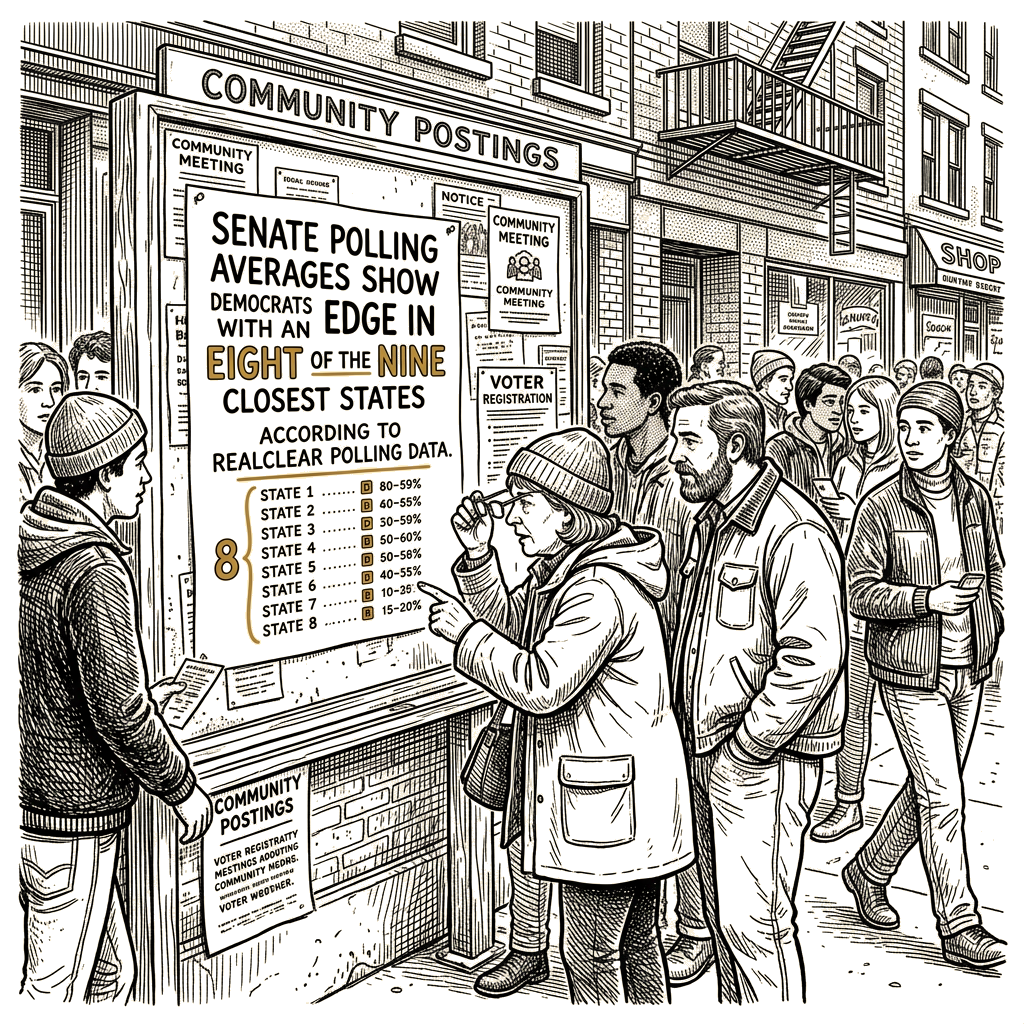
- Wall Street Journal-cited RealClear Polling averages place Democratic Senate candidates ahead in eight of the nine closest states, with forecasters producing joint probabilities of a full eight-state conversion ranging from roughly 2 percent under a race-by-race compounding approach to roughly 25 to 45 percent under a reference-class approach anchored to broader historical conversion patterns.
- WSJ Washington coverage chief Damian Paletta characterized polling as having “been spotty this year” and as having “underestimated GOP voters many times before,” describing the blue-wave scenario as “a little hard to imagine at this point” while presenting it as “a notable benchmark with six weeks left.”
- The race-by-race compounding approach treats documented polling underestimation, structural Republican advantages in Texas and Ohio, and the unfavorable historical record of insurgent candidacies by Abdul El-Sayed and James Talarico as stacked compressions on each per-race band; the reference-class approach treats underestimation as a two-to-four-point shift within larger polling leads.
- Per-race conversion bands span roughly 50 to 60 percent for Texas, 55 to 65 percent for Ohio, 60 to 70 percent for Michigan, and 65 to 75 percent for Maine, New Hampshire, North Carolina, Georgia, and Alaska; the joint eight-state sweep probability from the compounding approach (2 to 6 percent) sits well outside the reference-class approach’s range (25 to 45 percent).
- Update triggers that would shift the forecast include generic congressional ballot movement exceeding two points in either direction, late-cycle state polling shifts toward firms with documented Republican-friendly house effects, special-election results in the intervening weeks, and major news events with potential issue-salience effects.
RealClear Polling averages cited by Wall Street Journal Washington coverage chief Damian Paletta in the September 21, 2026 Politics newsletter show Democratic candidates leading in Texas, Ohio, Michigan, Maine, New Hampshire, Alaska, Georgia, and North Carolina, with Iowa the sole Republican-leaning state among the nine. Under those leads, Abdul El-Sayed and James Talarico would carry Senate races in Michigan and Texas — contests the Wall Street Journal described as ones Democrats “had not been expected to carry” and whose candidates the source characterizes as “considered long-shot winners.” Two analytical frameworks applied to the same substrate produce sharply different central estimates of the probability that all eight leads convert to actual wins: a race-by-race compounding approach yields a modal joint probability in the 3 to 4 percent range, while a reference-class approach anchored to broader historical conversion patterns yields a range of roughly 25 to 45 percent. The disagreement derives from analytical posture — how heavily documented polling bias, structural partisan lean, and long-shot candidate adjustments are stacked on each race — rather than from substrate disagreement, and the directional caveat Paletta raised is independently reinforced by Inside Elections’ Senate projection and Sabato’s Crystal Ball’s January 2026 ratings, both of which have Republicans favored to hold the majority.
The polling snapshot and its caveats
The nine-state cluster WSJ’s newsletter flagged as the closest races is anchored on RealClear Polling averages as compiled by WSJ Washington coverage chief Damian Paletta on September 21, 2026. Eight Democratic leads — Texas, Ohio, Michigan, Maine, New Hampshire, Alaska, Georgia, and North Carolina — and one Republican lead (Iowa) define the cluster. Under those stated leads, Abdul El-Sayed in Michigan and James Talarico in Texas would carry Senate races the Wall Street Journal described as ones Democrats “had not been expected to carry.”
Paletta attached explicit caveats to the snapshot, noting polling “has been spotty this year” and has “underestimated GOP voters many times before.” He described the blue-wave scenario as “a little hard to imagine at this point” while presenting the snapshot as “a notable benchmark with six weeks left” until the midterms. The same newsletter reported an advertising surge in named states — Texas and North Carolina, among others — with Paletta stating he could “vouch for the fact that ad spending is pouring in and blanketing America” after recent travel to Texas and North Carolina. The same newsletter also reported, citing advisers and administration officials, that President Trump has expressed frustration “behind the scenes about not having enough political allies defending him on television and making the case for his second-term achievements” — an inside-view indicator of incumbent weakness consistent with the structural midterm backdrop, though without specifying magnitude of seat loss.
Two analytical frameworks
Two forecasting frameworks anchor to overlapping substrate — Paletta’s snapshot, his caveats, the RealClear averages — and overlapping external reference points. Sabato’s Crystal Ball supplies the mid-summer incumbency rule that incumbents polling at 47 percent or higher in mid-summer averages have consistently won across the seven elections it has tracked. The DAD Math framework anchors to the FiveThirtyEight Senate polling archive and pulls more than 3,000 Senate polls from the last four election cycles. Across recent cycles, polls at T-minus-six-weeks have generally been directionally correct on leader identification but biased in magnitude, with the leader’s margin typically overstated. Inside Elections’ Senate projection as of 2026 has Democrats gaining a projected two to four seats, and Sabato’s Crystal Ball’s January 2026 ratings have Republicans favored overall.
The race-by-race compounding approach treats the three documented adjustments — polling bias, structural partisan lean, and long-shot candidate history — as stacked compressions on each per-race band, then treats the eight races as near-independent and aggregates. The reference-class approach anchors to broader historical conversion patterns and treats the polling underestimation as a two-to-four-point shift within larger polling leads; per-race outcomes are treated as drawn from a common underlying national environment with per-race moderators. The disagreement derives from how heavily the three adjustments stack, and how the eight races are aggregated, not from substrate disagreement.
Per-race conversion bands
Per the race-by-race compounding approach, the per-race conversion bands for the eight Democratic leads are: Texas, roughly 50 to 60 percent; Ohio, roughly 55 to 65 percent; Michigan, roughly 60 to 70 percent; Maine, New Hampshire, North Carolina, Georgia, and Alaska, roughly 65 to 75 percent. Texas and Ohio carry the largest compressions because they combine a structural Republican lean with the long-shot-candidate adjustment (Talarico) or the structural adjustment without a candidate-specific compression (Ohio). The broader per-race conversion baseline — any lead at T-minus-six-weeks historically converts at roughly three-quarters or better, with the precise figure depending on vintage and incumbency restriction — anchors all bands.
The compounding approach’s modal joint estimate for all eight leads converting sits in the 3 to 4 percent range, with the lower-bound joint calculation yielding roughly 2 percent and the upper-bound yielding roughly 6 percent. The probability of converting any given one of the eight leads is roughly 60 to 75 percent; the probability of converting between five and seven of the eight is roughly 15 to 35 percent. Bottom-line Democratic wins among these nine seats: between roughly three and six, with a modal estimate in the four-to-five range.
The reference-class approach yields a joint probability of an eight-state sweep in the roughly 25 to 45 percent range. Maine and New Hampshire are characterized as the most probable individual flips; Texas, Alaska, and Ohio as improbable but not impossible.
Where the frameworks diverge
The compounding approach’s modal range (3 to 4 percent) sits well outside the reference-class approach’s range (25 to 45 percent). Both approaches anchor to overlapping substrate and external reference points; the disagreement is analytical posture, not substrate dispute.
The divergence derives from two mechanisms. First, how heavily the documented underestimation, structural-lean, and long-shot-candidate adjustments are stacked: the compounding approach treats them as compounding compressions on each per-race band, while the reference-class approach treats the underestimation as a two-to-four-point shift within a larger polling lead. Second, how the eight races are aggregated: the compounding approach treats them as independent at narrow conversion bands, while the reference-class approach treats them as drawn from a common underlying national environment with per-race moderators. Races in the same cycle are correlated through national environment shocks — an asymmetric October turnout shift, for example — which the disclosed compounding math does not capture and which would understate the tail probability of an extreme outcome in either direction.
Inside-view drivers
For the reference-class approach, the inside-view drivers are structured around mechanism, motivation, capacity, environment, and base-rate-defying factors. On mechanism, turnout-model assumptions and likely-voter screens are identified as central: averages that weight registered voters over likely voters tend to overstate Democratic margins, with 2024 cycle post-mortems identifying this weighting choice as a contributor to polling’s “continued underestimation of Republicans’ support nationally and in the key swing states.” On motivation, the ad-spending surge in named states — Texas, North Carolina — is identified as signaling elite expectation of competitiveness in races that historically have not been competitive; ad spending alone is flagged as a weak signal because both parties are spending. On capacity, insurgent candidacies without strong institutional backing (El-Sayed, Talarico) carry an unfavorable historical base rate, with named historical referents including Beto O’Rourke (2018 Texas Senate, fell short against Ted Cruz despite competitive late-cycle polling), Stacey Abrams (2018 Georgia governor, won plurality but lost), Andrew Gillum (2018 Florida governor, won plurality but lost), and Conor Lamb (2018 House, district-specific factors that do not directly translate). On environment, the Trump-as-frustrated-incumbent signal from the same newsletter indicates incumbent weakness consistent with the structural midterm pattern but does not, on its own, indicate a specific magnitude of seat loss.
The structural partisan lean adjustment is anchored to Inside Elections’ Senate projection as of 2026 — which has Democrats gaining a projected two to four seats — and to Sabato’s Crystal Ball’s January 2026 ratings, which have Republicans favored overall. The magnitude per the race-by-race compounding approach treats polling leads in states with strong Republican structural advantages as converting to wins less reliably than the all-states average; the gap lies in the rough vicinity of five to fifteen percentage points, varying by cycle and race.
What would update the forecast
Pre-committed update triggers for the reference-class approach include: generic congressional ballot movement of more than two points in either direction; late-cycle state polling that shifts toward firms with documented Republican-friendly house effects, as informative on the underestimation question; special-election results in the intervening weeks, while imperfectly predictive; and major news events with potential issue-salience effects — Supreme Court decisions, foreign-policy developments, economic data releases. For the compounding approach, the polling bias adjustment magnitude and the structural-lean conversion gap would be the most consequential inputs to revisit, with each reviewable against a peer-reviewed or aggregator-published error-study decomposition by race type and state.
Unresolved inputs
The remaining uncertainties include: the precise magnitude of the polling-bias adjustment, with direction well-documented across 2016, 2020, and 2024 but specific magnitude for an average Senate race calibrated to “low-to-mid single digits” in the compounding approach and “two to four points” in the reference-class approach; the precise magnitude of the structural-lean adjustment, with Inside Elections and Sabato’s Crystal Ball anchoring direction but not publishing conversion-rate gaps for polling leads in safe-R states; the empirical base for the long-shot-candidate adjustment, which is thin and for which the analyst’s caliper is judgment-based; the race-by-race independence assumption underlying the compounding approach, which does not capture national environment correlation across states; and the lead-margin conditioning of the three-quarters-or-better base rate, which applies to leads of any margin (a 3-point lead and a 12-point lead are treated equivalently in the base rate). The 17-of-19 post-WWII figure for House-seat loss by the president’s party is used as a conventional political-science reference but is not independently web-verified in this turn. The probability tension between the two analytical postures is unresolved at the substrate level and represents a posture-level analytical choice rather than a substrate dispute, and would resolve with an external calibrated-forecaster review against a reference class with quantified underestimation magnitudes from a verified post-election report.
Analytical techniques used in this piece
This analysis applies the methods below. Each links to a short, plain-English explainer you can read and reuse.
- Probabilistic Forecasting
- Puts calibrated probabilities on what happens next.