
Trump is taxing imports and the price index doesn’t count it.
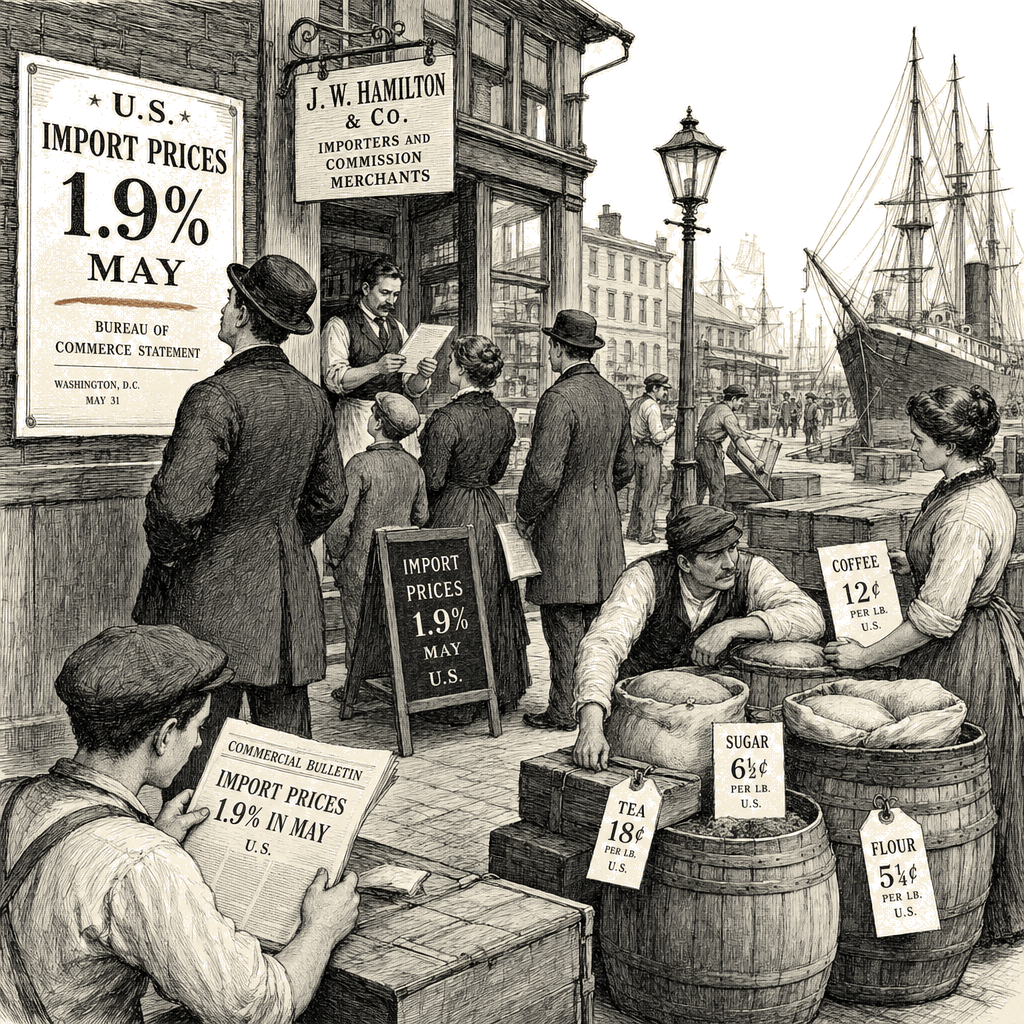
Here are the numbers. The Bureau of Labor Statistics reported Tuesday that U.S. import prices rose 1.9% in May — 6.7% over the past twelve months, the largest annual reading since August 2022. Economists polled by The Wall Street Journal had expected roughly 1.1%. That is a miss of nearly three-quarters of a percentage point on a monthly indicator, the sort of miss that in quieter times would set off a dozen alarm bells. Fuel imports climbed 12.5% on the month, driven by the Iran conflict — still a double-digit monthly rise in the energy inputs that ripple through every supply chain, from trucking to manufacturing to cold-storage. Nonpetroleum import prices accelerated from 0.6% to 0.8%.
Instead of alarm bells, the release was framed around a “slower rate” than April’s 2%, as if the arsonist had merely turned down the flamethrower. The headline tells one story. The methodology tells another.
The BLS Import/Export Price Indexes exclude duties — tariffs — from the price of imported goods. This is not new; the series has been constructed this way for decades. The index measures the price paid to the foreign seller, not the total cost to the American importer. The methodology footnote is explicit: import prices exclude U.S. import duties.
When tariffs were 2% or 3% on a narrow band of goods, this exclusion was an accounting convention with modest practical significance. It is no longer modest. The tariff regime this administration has imposed is the largest in nearly a century. CBO scores tariff collections as federal revenue — because they are federal revenue, collected at the port of entry by Customs and Border Protection, embedded in the cost of every dutiable import, and ultimately borne by the American consumer in the form of higher prices. The import-price index, by construction, does not include this tax.
What the index shows is the cost of foreign-made goods before the duty is applied. The 6.7% annual headline captures the Iran-driven energy spike that has been pressuring consumers for months and whatever foreign-producer pricing pressures are moving through nonpetroleum goods. It does not capture the tariff layered on top of every dutiable number in this report. It means the inflation pipeline is already carrying hot cargo before any protectionist levy touches it.
This matters for the same reason baseline conventions matter in budget scoring: the series you choose to cite determines the story you can tell. Cite the import-price index and the inflation story is an external shock — Iran, global energy markets, foreign producers raising prices. Cite the actual cost to the American importer inclusive of duties and the inflation story includes a deliberate policy choice this administration made and Congress has not countermanded.
The nonpetroleum figure demands separate attention. Nonpetroleum import prices rose 0.8% in May, accelerating from April’s 0.6%. The administration’s trade theory holds that tariffs reduce import demand and thereby put downward pressure on foreign-producer prices. Nonpetroleum import prices are not falling. They are accelerating. One month does not settle a theoretical question, but the direction is the opposite of what the tariff optimists projected when they sold the policy. Non-fuel import prices are no longer the tranquilizing force they were through 2025.
The consensus miss is the analytical hinge. If the forecasting community collectively underestimated monthly import-price growth by 73% — 1.1% expected versus 1.9% actual — we are not talking about a rounding error. It suggests the models used to project import costs are still underestimating the persistence and spillover of the Iran-war energy shock or the stickiness of nonpetroleum import prices. A 1.9% monthly gain, annualizing at something close to 25%, is not a deceleration worth cheering. It is an environment in which every downstream price — fuel, food, transport, wholesale goods — gets an upward shove. The “slower rate of increase” framing is a category error. It treats the direction of the second derivative as if it were the signal, when the level is the real danger.
The annual figure — 6.7%, highest since August 2022 — connects to the broader inflation acceleration. Consumer prices hit 4.2% in May, a three-year high. Import prices at 6.7% annualized are feeding that number, and the tariff component — invisible in this series — is feeding it further beneath the data. A year ago import-price inflation was nearly flat. Now it is running hotter than at almost any point in the past four years, and the only precedent in recent memory was the post-pandemic reopening spike of 2022 that briefly convinced the Federal Reserve it had lost control of prices entirely. Upstream import-price pressure is working its way into the CPI with an eight- to twelve-week lag.
The Federal Reserve cannot raise rates against a tariff. Monetary policy addresses demand-pull inflation. A tax on imports is cost-push. The central bank is tightening against the symptom while the cause sits in a policy instrument it does not control and a data series that does not name it.
The tariff is a tax. The price index is built not to count it. This is not a conspiracy; it is a methodological convention that has outlived its innocence. The relief is not in the data. It’s in the headline. Any honest accounting of what imports cost American consumers starts with the number in this report and then adds the number this report was designed to leave out.