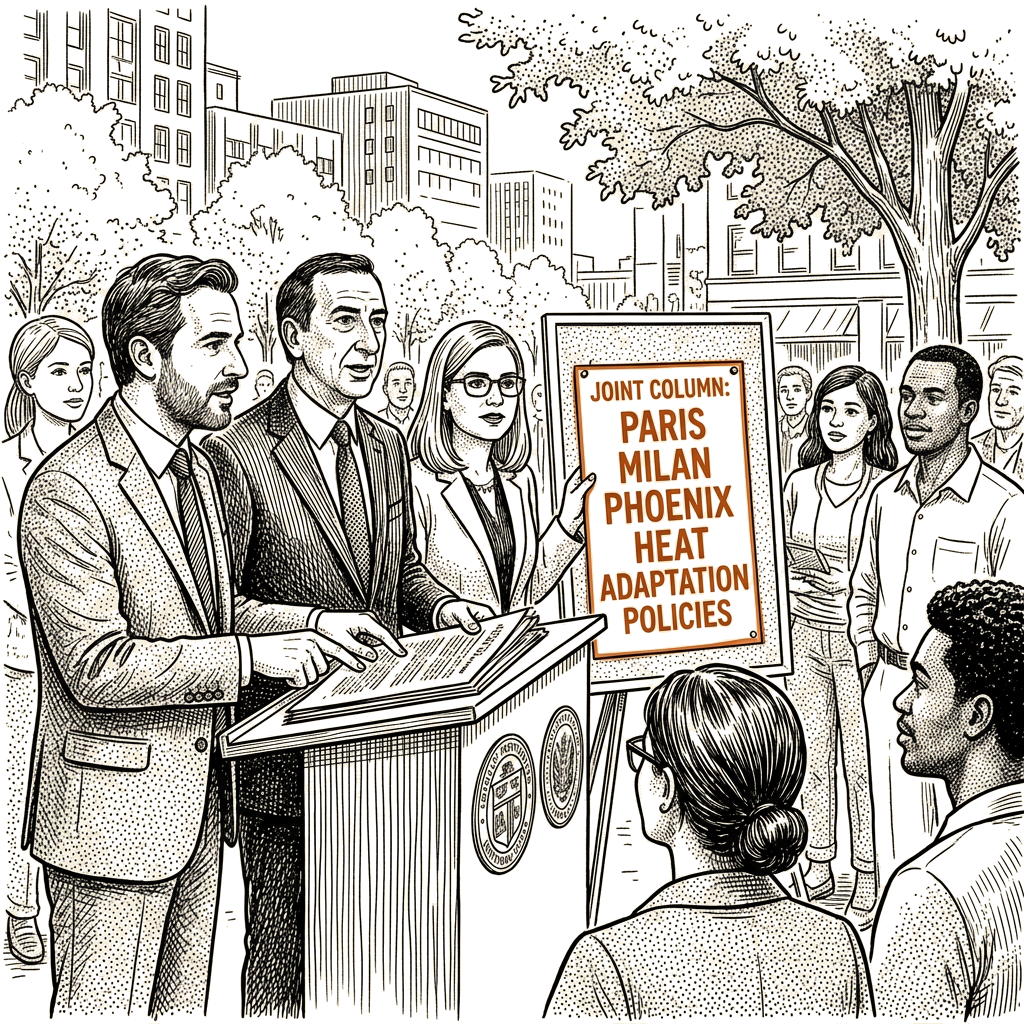
The joint Guardian column published September 7 by Paris mayor Emmanuel Grégoire, Milan mayor Giuseppe Sala and Phoenix mayor Kate Gallego presents Phoenix’s 20% year-over-year decline in heat-related 911 calls during the summer of 2024 — described in the column as the city’s hottest on record — as evidence that “coordinated heat response” is reducing harm. A causal-DAG analysis of that attribution identifies the assumption embedded in the column’s claim and the alternative pathways that the column’s own evidence does not rule out.
Per Judea Pearl’s causal hierarchy, the column’s claim operates at the observational rung — noting a co-occurrence between Phoenix’s heat programs (a 75% shade-coverage requirement for new developments in high-pedestrian areas, cool-surface treatment applied to more than 300 kilometers of neighborhood streets, a landlord obligation to maintain indoor temperatures at or below 28°C, a 24-hour cooling center, and heat-safety plans required of city contractors) and an outcome (heat-related 911 calls). The column does not specify which intervention, or which combination, is doing the causal work; it does not isolate the effect from non-intervention variables that move on the same timescale; and it does not state the absolute call volume from which the 20% figure is calculated.
A differential diagnosis of the 20% decline produces several competing hypotheses that the column’s evidence does not discriminate between. H1, the column’s preferred explanation, attributes the decline to the city’s heat programs. H2 attributes it to resident behavioral adaptation — increased air-conditioning use, altered trip patterns during peak heat hours, or earlier-season acclimatization — that the column does not measure. H3 points to weather variability within the 2024 summer: a year described as the hottest on record may nonetheless have had fewer consecutive extreme-heat stretches than a comparison year, and 911-call volumes are sensitive to heat-event duration as well as to peak temperature. H4 points to measurement effects, including any change in how heat-related calls are categorized by dispatchers. H5, a candidate the column does not address, raises the possibility that the most heat-vulnerable residents did not survive to make calls in 2024 — a selection effect that would simultaneously reduce call volume and worsen aggregate mortality. H5 is the hypothesis most likely to be dismissed on priors but is precisely the one the column’s evidence cannot adjudicate, since the column reports heat-related 911-call data for Phoenix and cross-European heat-related mortality but no Phoenix-specific heat-related or all-cause summer mortality for 2024. The differential-diagnosis test asks whether any single piece of column evidence rules any hypothesis out; the answer is that none does, because the column reports only the aggregate 911 figure and not the call-rate, exposure, mortality, or intervention-coverage data that would let a reader arbitrate between candidates. The depth of this differential diagnosis follows the column’s own asymmetry: Phoenix is the only one of the three cities offering a quantitative outcome attribution that the analysis can interrogate.
A causal-DAG inventory of variables for this question classifies global heating as a root cause, the local urban heat island effect as a mediator, shade coverage, cool-surface area, indoor-temperature compliance, cooling-center capacity, and behavioral adaptation as candidate interventions and confounders, and 911 calls as one outcome measure — distinct from heat-related mortality, hospital admissions, and economic-productivity loss. The 14,000 heat-related deaths the column attributes to Europe this summer is a separate node, a population-level mortality outcome across a different geography, and the column does not bridge it to Phoenix’s call data except by parallel construction.
The wicked-future frame surfaces a tension that the probability overlay alone does not. Phoenix’s 2024 summer was the hottest in the city’s recorded history, and the column reports the 20% decline against that record. If the same programs face a still-hotter summer, the question is whether the interventions scale linearly with the hazard or asymptote. The column’s Phoenix section does not address adaptation capacity beyond the existing programs; the Milan section, by contrast, sets a binding target of no more than 2°C of local warming by 2050, which Sala described in the column as “very ambitious,” and the Paris section reports an October 2023 exercise — “Paris at 50°C” — designed to test municipal responsiveness at a temperature Paris has not yet experienced. The three cities are therefore planning at different reference horizons: Phoenix against last year’s record, Milan against a 2050 temperature budget, Paris against a not-yet-observed 50°C scenario. The differential-diagnosis rival hypotheses (H2–H5) become more consequential at each city’s own planning horizon precisely because none of the three program inventories generate the baseline, exposure, and outcome data needed to rule them out at the city’s reference temperature. The pre-mortem failure pathway common to all three is that the adaptation programs described in the column — shade, cool surfaces, cool spots, volunteer outreach — are designed against a hazard profile that the column’s own evidence (the 14,000 deaths, the “hottest on record” label, the 50°C exercise) indicates is moving.
The column’s call for national-government funding and for cross-city learning through the C40 Cities network is consistent with the structure of the problem the column itself documents: cities acting within fixed municipal budgets against a hazard whose scale is set by national and supranational emissions trajectories. The “Good ideas should travel” framing treats policy transfer as the binding constraint; the differential diagnosis above indicates that the binding constraint on evaluating any transferred policy is the availability of baseline, exposure, and outcome data at the receiving city, which the column does not address.
Analytical techniques used in this piece
This analysis applies the methods below. Each links to a short, plain-English explainer you can read and reuse.
- Causal DAG
- Maps cause and effect as an explicit directed graph, exposing confounders and mediators (Pearl).
- Differential Diagnosis
- Lists the candidate explanations for a symptom and rules them out one by one.
- Wicked Futures
- Explores a long-horizon, deeply entangled future with no clean resolution.