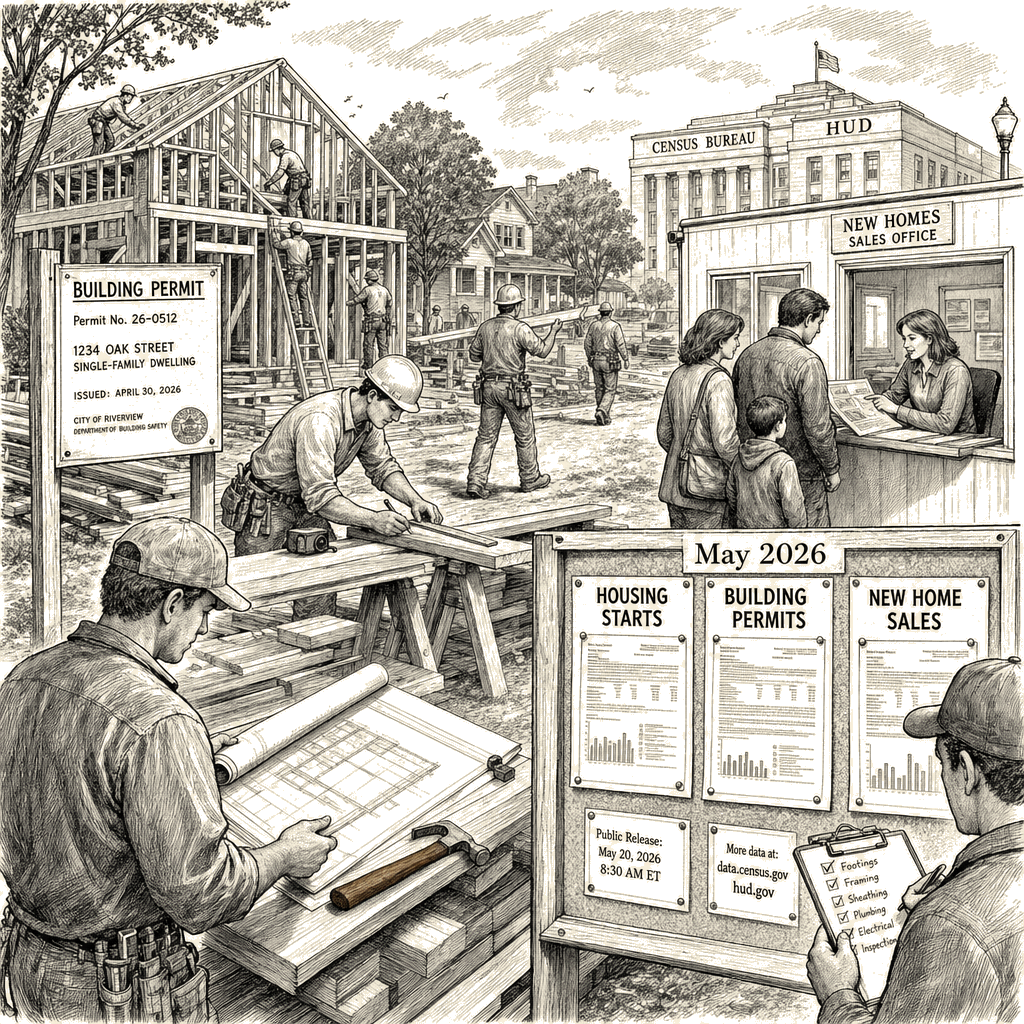
The Census Bureau and the Department of Housing and Urban Development on Thursday released the May 2026 figures for new residential construction and new single-family home sales, providing the latest official reading on the U.S. homebuilding sector at a time when elevated mortgage rates and a persistent housing shortage continue to shape market conditions. The report includes national totals for housing starts and building permits, broken out by region and by structure type (single-family and multifamily), while the new-home-sales release reports the number of newly constructed single-family homes sold during the month and the median sales price. Main Street Independent will update this article with the specific May numbers, regional distribution, and a full distributional affordability analysis once the verified data have been processed.
The releases are the principal federal measures of residential construction activity and new-home pricing. Housing starts are recorded when excavation begins for a new residential unit; building permits—required before most construction can proceed—serve as a forward-looking indicator of future starts. Together, the two series offer a current snapshot and a short-term outlook for homebuilding, which policymakers and market participants track closely as a gauge of whether the industry is adding enough supply to ease housing-cost pressures.
Those pressures remain acute. White House economists have estimated the U.S. housing shortage at about 10 million units, and a long-running gap between new construction and household formation has kept prices elevated even as mortgage rates have climbed. Freddie Mac’s latest Primary Mortgage Market Survey placed the average 30-year fixed mortgage rate near 6.5 percent, a level that has sharply reduced affordability for first-time and moderate-income buyers over the past year. The Census Bureau reports will allow analysts to assess whether May construction activity moved the supply needle and whether the regional pattern of building-permit issuance points to broader relief in the most unaffordable markets.
The May housing data will also feed into the shelter component of the Consumer Price Index, which is among the largest drivers of overall inflation and which distributes its burden unevenly: lower-income households spend a larger share of their budgets on housing than higher-income households do. The Atlanta Fed’s Home Ownership Affordability Monitor provides a complementary regional lens, tracking how changes in median home prices, mortgage rates, and income interact to alter affordability. Main Street Independent will incorporate both the CPI shelter context and the Atlanta Fed’s affordability measure when the full analysis is added to this article.