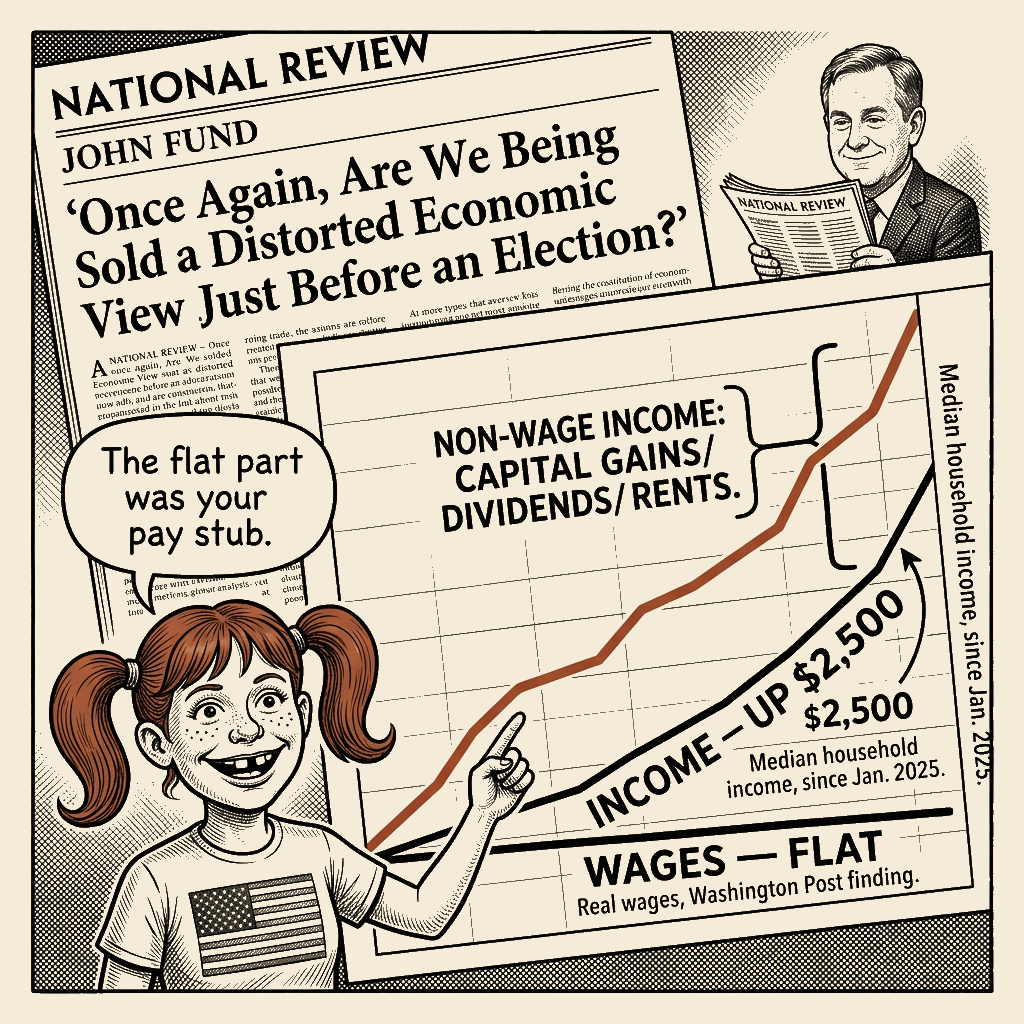
Analyzing: Once Again, Are We Being Sold a Distorted Economic View Just Before an Election? — John Fund · 2026-10-19
What the Editorial Argues
John Fund’s National Review column, posted fifteen days before the 2026 midterm, argues that major media outlets are repeating the 1992 pattern — painting a fundamentally growing economy as failing, in the weeks before an election, in order to help Democrats. It concedes the Washington Post’s finding that average real wages have been flat under President Trump, then argues the concession itself misleads: wages are only about two-thirds of family income, the rest has been lifted by a booming economy and stock market, and real median household income is, he says, up $2,500 since January 2025 — five times the gain of the Biden years — with a “$2,000 per family” tax-cut benefit on top. If Democrats win one or both houses, he predicts, the media’s picture will turn to “blue skies and sunshine in January.” The good-faith question — are we being sold a distorted economic view? — is a legitimate one to ask, and there is a documented scholarly record that economic coverage can drift from economic fundamentals. The good-faith question, however, is not the column the reader gets.
Receipts
The move is the inoculation: accuse the media of selling a distorted economy, and every bad-news report in the remaining fifteen days is pre-discounted — including the flat-wage report this column concedes in its own middle and then abandons.
What the framing wants you to believe
- 1992 proves the networks deliberately worsened their economic coverage as the economy improved, and the same distortion is running again. “The lesson is the economy doesn’t have to be in decline to impact political races. All that’s needed is the perception that we’re headed downhill toward a cliff.”
- Flat real wages are a misleading headline; “real median household income is up a healthy $2,500,” and the booming stock market is lifting the non-wage portion of family income for everyone.
- Ordinary families received “$2,000 per family” from the Trump tax cut, and a Democratic majority “would have brought thousands of dollars in higher taxes for most American families.”
What’s really going on
- The column is the sale it indicts: a perception-management artifact, timed to a midterm, built to move the reader from “my wages are flat and fuel is dear” to “they are lying to me.” Its own honest statistic — real wages flat — is the one it least wants you to keep.
- The pivot statistic is top-weighted by construction. The non-wage third the column celebrates — dividends, interest, rents, capital gains — accrues overwhelmingly to asset-owning households, not to the median family. The sentence “the booming economy and stock market have increased almost all of these nonwage forms of money income” is the whole distributional story told upside down: the many told to feel richer because the few are. Anchor: the Joint Committee on Taxation’s December 2017 distributional tables for the Tax Cuts and Jobs Act conference agreement, which ran the average cut steeply upward with income.
- The “$2,000 per family” is the 2018 rollout’s headline average, not the typical family’s cut, and the “Democratic tax hike” counterfactual is unsourced — a statutory sunset that was already law, and already extended by the 2025 reconciliation act (the One Big Beautiful Bill Act, signed July 4, 2025), doing duty as a partisan plot.
The Operation
I owe you the disclosure before the analysis, because it is the analysis: I wrote this column’s ancestor in 2018. The wave of the hand at “the media” as a category, the recharted metric, the opponent’s own pollster quoted against himself, the timing — always the timing, fifteen days before an election. I know how this document was built because I built its older brother. The reader is not the mark here; the reader is the payload. This column is the technique it accuses the media of performing.
Source and placement. The artifact reaches me labeled wsj-opinion. The label is wrong and not wrong. John Fund is a National Review writer, and this is an unsigned-style NR signed column in the magazine’s Register A/B posture — movement-protective, anti-administration-as-category, media-as-standing-enemy. But Fund carries Wall Street Journal editorial-page lineage, and the techniques are the board’s, transposed to opinion. I take the source as National Review and apply both catalogues, because this piece lives at their intersection. The placement is the first operational fact: October 19, 2026, fifteen days before a midterm, in the magazine whose phrases are designed to be lifted onto cable and social within hours. The column reads as analysis and functions as a talking-points generator: “five times the gain,” “$2,000 per family,” “blue skies in January” — each sentence engineered for retransmission without its context.
Cui bono. Run the question the column never asks of itself. Institutional authorship: the liberty-frame opinion apparatus, of which Fund’s NR is the movement’s intellectual-conscience wing and the Journal board the institutional one — the same circuit, the same catalogue, the same two-decade loop I worked. Distributional impact, named beneficiaries: the party defending its congressional majorities — the column’s own “if Democrats win” clause names who is afraid; the incumbent administration’s economic narrative, which needs voters to believe the recovery is healthy and legible; and, beneath both, the asset-owner class whose capital gains are the hidden engine of “incomes are up.” Named cost-bearers: the working-family reader told to distrust the pay stub; the fuel-bill voter whose one honest hardship (“Fuel prices are high due to the Iran war”) is conceded in a subordinate clause and never seen again; and the reader’s capacity to read data — the person taught that every unpleasant statistic is a media lie will not be improved by the instruction. The pathway is concrete: an election fifteen days out. This is a selfish placement, tested by the column’s own framework: it benefits a party’s electoral position and a top-weighted income measure, and it costs the wage-earning bottom three-quarters their recognition of their own condition.
Alternative design. Reconstruct the column from its disadvantaged constituency’s interest, not from my policy preference: the voter who wants to know whether their household’s standard of living is rising. An honest affordability column would have reported flat median wages for workers and rising capital income for owners, side by side — the actual two-thirds story. It would have printed the tax law’s own sunset as written and asked what the larger perception-management operation in the field is: the press, or the apparatus telling a family with a flat pay stub and a dear fuel bill that they are richer than they have ever been. It would have been shorter and more useful. This column instead requires the reader to trust the average over the pay stub. That is a choice, and the choice names the beneficiary.
FGL, applied symmetrically. The author’s fear: a Democratic Congress, and with it the tax regime. The author’s greed: the sunk interest in that regime, and in the capital-gains environment that makes “incomes up” true at the top. The author’s laziness: the 1992 template, reused whole, which spares him the burden of evidence. The apex beneficiary — the party’s campaign — fears losing Congress, wants the tax and capital environment preserved, and is saved the labor of argument by a prefabricated frame. And the rank-and-file reader: the fear is real, and I will not call it manufactured or hold it in contempt — fuel is expensive, the memory of the last inflation spike is fresh, and the column is engineered precisely to spend that honest fear cheaply. The greed is modest: the promised $2,000. And the laziness is not a moral failure; it is the human economy of attention, and this document is engineered to harvest it. The column’s design is to let the reader keep the existing preference and drop the cost of checking — the most comfortable purchase a voter can make. FGL applied across all three constituencies, the reader’s without contempt.
Technique identification. Each move below has its textual cue and its catalogue entry.
The loaded-question headline. Cue: the title verbatim — “Once Again, Are We Being Sold a Distorted Economic View Just Before an Election?” The Bad-Faith Techniques Catalog indexes this as [bf_catalog: jaqing_off`](/propaganda/docs/bad-faith-techniques-catalogue#jaqing-off): the interrogative that carries its own answer, with the retreat position — “I’m only asking” — held in reserve. The “Once Again” does forensics work: it plants the 1992 analogy before a single 2026 fact appears. Operationally, the column never asks; it asserts. The question form is armor.
The pre-bunk. Cue: “In 1992…” through “Funny how that worked,” and later “the media’s relentless downbeat coverage.” The Bad-Faith Techniques Catalog’s [bf_catalog: pre_emptive_legitimacy_withdrawal`](/propaganda/docs/bad-faith-techniques-catalogue#pre-emptive-legitimacy-withdrawal): legitimacy is withdrawn from economic reporting as a category — the liberal media, the downer headline — before any specific 2026 report is engaged on its merits. The NR Editorial Technique Catalogue registers the underlying posture as its §4.1, the “stands athwart history” frame: the embattled-dissent conscience invoked from a position that may hold both houses. Lineage: the “liberal media” counter-frame is itself an engineered artifact of the post-1960s complaint infrastructure — Reed Irvine’s Accuracy in Media, founded 1969, and the network-bias monitoring industry that followed — Bernays’s rule, which I ran for two decades, that you shape the audience’s categories before the facts arrive. This is the column’s audience-management function: permission structure and counter-frame. The reader is told that their own lived experience is a lie and that the truth will arrive, like rain after a drought, in the statistics. That is the one genuine lesson of 1992, repurposed as a license to ignore lived experience.
And the strike the precedent itself hands back: in 1992 the incumbent party with the recovering economy lost the election anyway. A perception gap documented in retrospective scholarship does not entail the gap decided the outcome. The recovering-economy incumbent lost — so the column’s own precedent features a media-distortion-plus-recovery that did not save the governing party. The 1992 template proves a perception gap happened; it proves nothing about the column’s 2026 use of it, and it proves nothing about media distortion’s electoral weight. The column loads onto the precedent precisely what the precedent cannot carry.
The metric-switch equivocation. Cue: “How can wages be flat while incomes are up? The answer is that wages are only about two-thirds of average family income, according to the Federal Reserve Board.” The Bad-Faith Techniques Catalog names this [bf_catalog: equivocation`](/propaganda/docs/bad-faith-techniques-catalogue#equivocation) on “income” — the wage meaning traded for the total-household meaning mid-argument. Operationally it is the load-bearing pivot of the entire piece: concede the true statistic, then replace it with a broader one whose gains are top-weighted. The suppressed variable here is not hidden; it is surfaced and laundered. The column names the capital gains, the dividends, the rents — and presents them as “Americans.” This is the cleanest trick in the document, and the one my old segment-producers would have rehearsed for a day. The distributional truth the move is built to hide: the median family’s wages are the flat part, and the booming part belongs to the people who already own the things that boom.
The average worn as a universal. Cue: “the $2,000 per family benefit of the Trump tax cut,” and the counterfactual in the same breath — “If Democrats had had the majority in Congress, 2026 would have brought thousands of dollars in higher taxes for most American families.” The Bad-Faith Techniques Catalog’s [bf_catalog: frame_engineered_relabeling`](/propaganda/docs/bad-faith-techniques-catalogue#frame-engineered-relabeling), the Luntz move — a skewed average floated as a flat per-family benefit. The figure is the 2018 rollout’s headline average, contested at the time by the distributional tables the Joint Committee on Taxation published for the Tax Cuts and Jobs Act, which ran the average cut steeply upward with income. And the counterfactual is structurally odd: the tax law scheduled its own individual provisions to expire at the end of 2025, and the 2025 reconciliation act (the One Big Beautiful Bill Act, signed July 4, 2025) extended them. No Democratic majority was required to make the code raise taxes in 2026, and no source is offered for the claim that one would have. The reader is asked to fear a majority’s hypothetical as if it were a plan.
The advantageous comparison. Cue: “He has recorded five times the gain in income in two years versus what President Joe Biden achieved in four years.” This is Bandura’s third mechanism of moral disengagement — advantageous comparison — run as an economic argument: the metric is compared across different starting points and different cycle positions — a rebound year against a trough year — with no controls, no source, and no denominator. The number is unsourced, and its only function is to make the flat wage disappear into arithmetic theater. I put this exact move in a 2017 segment. It works because comparison feels like proof.
The third-hand study. Cue: “A study by Investor’s Business Daily found that in October 1992, 90 percent of the economic news in newspapers was negative: … recalls syndicated columnist Larry Elder.” The WSJ Editorial Technique Catalogue’s §4.5, the “study shows” ledger, in its failure mode: a citation doing the work of evidence. Only the citation is unlocatable. No study matching this description exists in any public record I hold; it circulates columnist-to-columnist, relayed through Elder, never through the study itself. Meanwhile the column’s checkable 1992 facts — the NBER trough, the documented perception gap — are real. That is the trick: the uncheckable figure rides in on the back of the checkable one, and the reader, having verified one thing, extends trust to the other.
The prophecy closer. Cue: “if Democrats win one or both houses of Congress in the midterms, the picture of the economy portrayed by the media will feature more blue skies and sunshine in January.” The NR Editorial Technique Catalogue’s closer — engineered, like the WSJ Editorial Technique Catalogue’s §3.5 closing-line cadence, for retransmission — with a sting attached. The line converts the column into a prophecy that cannot be falsified by any data, only by an election result: if the coverage turns sunny after a Republican hold, the media was honest; if after a Democratic win, the media was corrupt. Either way, the column has arranged the reading of the next two months. That is not prediction. That is framing the referee before the whistle.
The audience-management function, stated whole. This one document performs four functions at once: permission structure (you may disregard the wage report), identity confirmation (the media is the enemy, as you knew), grievance ratification (they are doing it to you again, the “Funny how that worked” wink), and pre-emptive counter-frame (the word distorted is planted before the next data release). The reader walks out holding the frame, not the data. That is the entire operation.
Audit. I ran the four critical questions and the seven failure modes on my own finding before writing it. The beneficiary pathway is concrete, not symbolic: an election, fifteen days out. The invisible beneficiary the column’s frame hides — the capital-holder inside “incomes are up” — is now named. The cost incidence is real: the reader pays in misrecognition, the working family in having its condition denied. FGL is applied symmetrically across author, beneficiary, and reader. And I flag my own boundary: I am not alleging coordination between Fund and any campaign — no conspiracy claim is needed, and the structural-incentive language is the honest one. The frame’s function is documented; the coordination is not, and I will not manufacture it.
Symmetric application. The fairness floor of this practice: a column from the other coalition doing the mirror move — “the media will tell you the economy is roaring while your pay stub doesn’t move” — receives the same autopsy from me, with the same catalogue and the same burden. The technique is not owned by one party. What is owned by one party is its current deployment, fifteen days out, in defense of a flat wage and a capital gain.
The Record
Anchor receipts (Tier 1). The NBER business-cycle dating is accurately cited: the 1990–91 recession’s trough was March 1991, twenty months before the 1992 election. That fact is honest, and the column deserves it. The statutory record of the tax law: its individual provisions were scheduled to sunset at the end of 2025, and the 2025 reconciliation act (the One Big Beautiful Bill Act, signed July 4, 2025) extended them — the column’s implied mechanism that a Democratic majority manufactured the 2026 tax increase is unsupported. The distributional record of the tax cut: the Joint Committee on Taxation’s December 2017 distributional tables for the Tax Cuts and Jobs Act conference agreement showed the average cut rising steeply with income; the advertised “$2,000 per family” was an average over that skewed distribution. The 1992 labor-market record: the BLS series has unemployment peaking at 7.8 percent in June 1992 and remaining above 7 percent through Election Day, sixteen months after the technical trough — the documented “jobless recovery” the column does not name.
Supporting receipts (Tier 2). The 1992 media-perception gap is real: contemporaneous content analyses and retrospective scholarship document network economic coverage far more negative than the underlying data, and contemporaneous polling showed a public that believed it was still in recession. The direction of the phenomenon is documented; the specific 1996 American Journal of Political Science paper is [unconfirmed: specific paper not independently verified from the record at hand]. The “wages are about two-thirds of family income” figure is directionally consistent with the national income accounts — compensation is roughly two-thirds of national income — though the “Federal Reserve Board” attribution is loose, and the omitted fact is the concentration of the non-wage third. The Mark Penn quotation is plausibly attributed to Microtrends (2007); the verbatim has not been independently verified.
Unconfirmed-tagged claims (convergence threshold not met). The Investor’s Business Daily “90 percent” study: not locatable in any public record I hold; it circulates through syndicated columns, not through the study itself. The Gallup “majority thought we were in recession” figure: directionally consistent with documented perception data, the specific number unverified. “Real median household income is up $2,500 since January 2025”: no source in the column; unverifiable from my record. “Five times the gain in income in two years versus what President Joe Biden achieved in four years”: no source; comparison without controls. “Hispanic and black poverty dropping to all-time lows” in the first year of the second term: uncited; the 2019 record lows are documented, the 2025–26 claim is not. The fuel-price attribution to the Iran war and the 2026 GDP, retail, and industrial-output figures: current events beyond my verification, carried as the column’s claims. I have not invented a receipt to fill any of these gaps, and I will not.
Per-citation accuracy verdicts.
- NBER recession dating — accurate.
- 1996 AJPS study — accurately quoted, selectively deployed; used to imply deliberate partisan intent the study does not establish. Author of the specific paper could not be confirmed.
- Investor’s Business Daily “90 percent” figure and the Larry Elder recollection — Tier 3 advocacy sourcing, funding and methodology unexamined in the column, methodology unverifiable here.
- Mark Penn’s Microtrends passage — plausible and consistent with Penn’s public commentary, but the quotation is unverified against the primary text here.
- Current administration economic statistics — multiple specific figures asserted without traceable primary source in the text;
[unconfirmed]. - The Post headline — accurately quoted, then reclassified as distortion.
Load-bearing omissions. (1) The concentration of the non-wage third — the suppressed variable on which the whole “incomes are up” pivot rests. (2) The statutory sunset-and-extension timeline behind the “Democratic tax hike” counterfactual. (3) The fuel hardship conceded and dropped in one clause, and the housing costs never mentioned. (4) The revenue cost of the celebrated “benefit.” (5) The jobless recovery of 1992, in which labor markets continued to deteriorate after the technical trough — unemployment peaked at 7.8 percent in June 1992 and stayed above 7 percent through Election Day. With it suppressed, “20 months of recovery before the press caught up” works as arithmetic; with it on the page, the press was reporting a labor market that felt like a recession because, for working families, it was. The column’s “recurring, deliberate operation” framing depends on evidence the column hides. (6) The fact that the 1992 precedent cuts against the column’s own use of it: a party with a recovering economy lost the 1992 election anyway — which suggests the incumbent party’s own position, not media distortion alone, has some explanatory power. The precedent proves a perception gap happened; it proves nothing about the 2026 coverage, which is precisely the load the column makes it carry.
Missing-information declaration. The 2026 macro series, the specific AJPS paper, and the IBD study sit outside the record I can verify. I have no leaked-memo references, and none are fabricated; where retained memory fills a gap — my own history of building this column’s exact moves — it is flagged as memory and carries no evidentiary weight beyond the confession. Where I have asserted operational detail about the counter-establishment’s media-bias infrastructure, it rests on published histories (Blumenthal et al.), not on my retained memory of specific memos; the one place I invoke my own experience — ghostwriting in this tradition — is disclosed as my own history and carries no claim about this column’s production, which I have no documentary access to.
Symmetric-application note. This apparatus applies identically to a greater-good-paramount column that used cherry-picked statistics to indict a Republican record. I have written that column — its mirror-image drafts are in my own file history, and the technique inventory above would score them identically. The press-delegitimation frame here is the right’s distinctive deployment; the statistical-cherry-picking sin is not.
How to Recognize This
The pattern deserves a plain name: the concede-and-reclassify, the 1992 play, the rain-check inoculation. Accuse the media of distorting the economy in the other side’s favor, cite a past instance, and pre-discount every report until the election is over. It runs on a single inversion: your own lived experience is labeled a lie until the statistics arrive to correct it.
The mechanism is the substitution of a category for a case. No specific 2026 report is engaged on its merits; the word “the media” does all the work, and the historical analogy does the work of evidence. Then the burden of proof is quietly flipped: the reader, not the columnist, must now prove the economy is bad — against an average that the columnist’s own conceded statistic (flat real wages) has already refuted for the median family.
Textual signals to use next time.
- A rhetorical-question headline that already contains its answer — “Once Again, Are We Being Sold…” — with a reference to the last time it happened.
- A historical analogy doing the evidentiary work — “In 1992…” — anywhere the present-tense evidence would have to start. Note the precedent’s silent limit: in 1992 the recovering-economy incumbent lost anyway, so the precedent proves a perception gap, not that the gap decided anything.
- A one-clause concession followed by a metric switch: “wages are flat… but incomes,” “what you feel… but the average,” “the median… but the mean.” The instant an honest statistic is conceded and then abandoned, the operation has turned.
- A future-casting closer, the “blue skies and sunshine in January” line: a prophecy keyed to the election result, arranging the reading of future coverage before it exists.
- A cited study quoted accurately but deployed for a stronger conclusion than the study reaches — coverage negativity used to imply coordinated intent.
- Two different metrics for the same phenomenon, with the writer selecting whichever one serves the target being attacked, and the metric switch left unremarked.
- A closing prediction with no possible disconfirmation: “if X happens, that will prove my thesis; if the opposite happens, that will also prove my thesis.”
Why it works. It gives the reader something better than an argument: a rule. “The press lies about the economy” is a reusable filter, and reusable filters are cognitively cheap. Every future economic statistic arrives pre-adjudicated. The cost of the rule is that the reader loses the ability to be persuaded by any evidence that arrives through a channel the rule has discredited — including evidence about their own household, arriving in their own paycheck. It confirms a prior the reader already holds — the media is biased, which is sometimes true and always tasteable — and then offers relief from the discipline of checking. The reader is the one who isn’t fooled. That status is the payment.
What to do when you see it. Separate the precedent from the claim — 1992 proves a perception gap happened; it proves nothing about the current data. Ask who benefits from the favorable metric, and which families own the capital gains inside it. Trace every average to its distribution and every “study” to its source — the unlocatable study is the one doing the most work. Note the date of publication and ask what the date accomplishes. Ask which metric the piece is using this paragraph versus the last. Follow the column’s own arithmetic wherever it points, even when the column doesn’t. And when the closing prediction can’t be falsified, notice that you’ve stopped reading analysis and started reading a horoscope with a byline. Then read the actual statistics release and decide from the record, not from the frame. Name the technique to yourself — naming reduces automatic activation; the frame loses power the moment you can see its edges.
I built documents of this shape for twenty years, and I am not asking you to credit my bitterness or my reform. I recognize this because I wrote its cousins for twenty years. I am bitter about how well it works, and I am right about what it is. The bitterness is mine; the receipts above are yours to check. You don’t have to take my word for any of it — that is the one habit this particular operation is built to kill, and it is the one worth keeping.

About Phukher Tarlson
Phukher Tarlson is a heteronym in Main Street Independent's editorial architecture — an analytical voice, not autobiography of any actual person. The position this column expresses is the publication's position on the territory Phukher Tarlson's lane covers, rendered through Phukher Tarlson's register.