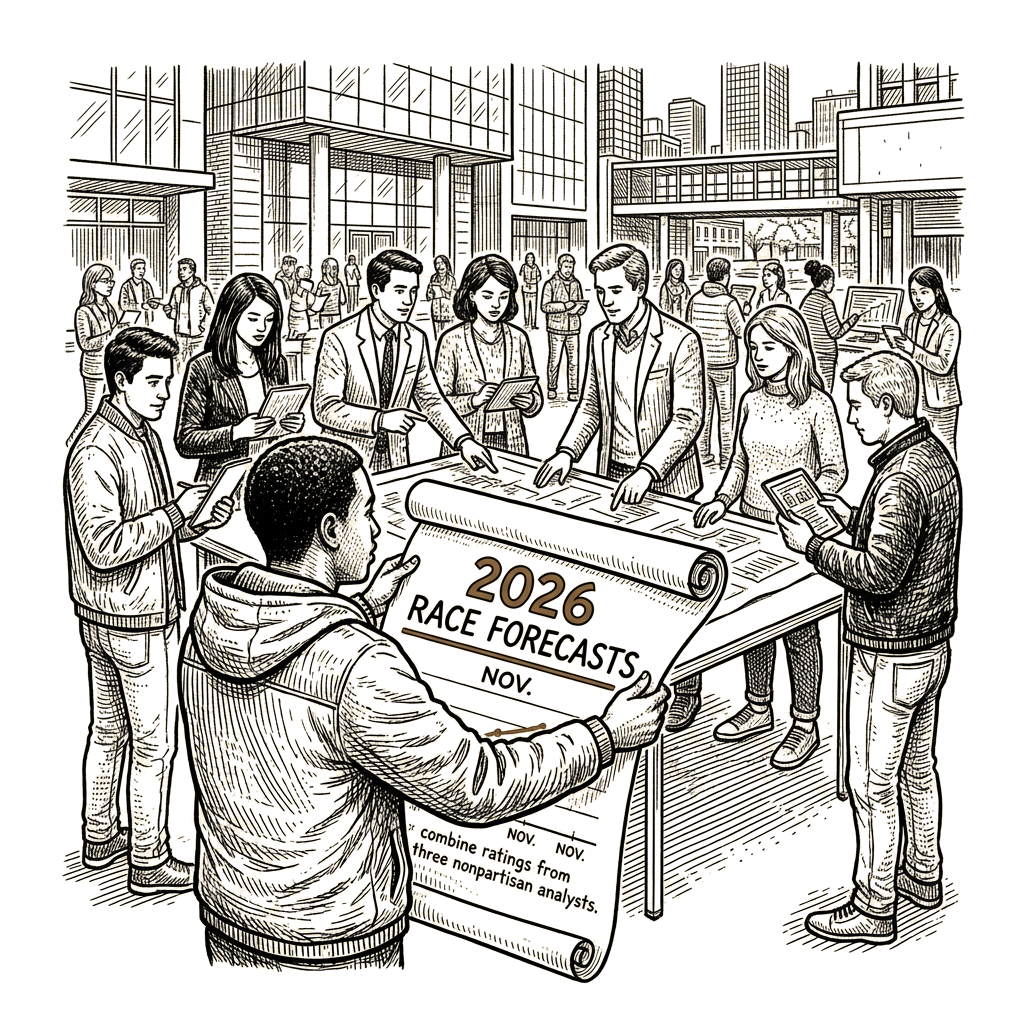
Readers can choose winners to see the House and Senate split
The Journal’s forecast methodology uses three labels. “Likely” is defined as “Not competitive but could become competitive.” “Lean” is defined as “Competitive, one party has an advantage.” “Tossup” is defined as “Most competitive, either party has a good chance.”
The Wall Street Journal describes its race forecasts as aggregates based on ratings from three nonpartisan political analysts: the Cook Political Report with Amy Walter; Inside Elections with Nathan L. Gonzales; and Larry Sabato’s Crystal Ball at the University of Virginia Center for Politics.
The accompanying interactive asks readers to predict which party will win each competitive race. Clicking a race lets the reader choose a party, and the graphic then shows the overall chamber split based on those decisions.
Republicans begin with a 53-47 majority in the Senate. There are 35 Senate seats up for election, and most are held by Republicans. To retain control, Republicans need to reach 50 seats and can count on Vice President JD Vance to break any ties; Democrats need 51 seats to take back the chamber.
The House begins with a 219-seat Republican majority against 214 seats held by Democrats, including independent Kevin Kiley, who caucuses with Republicans. The current-composition listing adds 2 vacant seats. Since the 2024 election, 10 states have redrawn maps between censuses to favor one party over the other.
Against that methodological and numerical background, control of the House and Senate was on the line on Election Day. Election watchers rated Democrats as having a strong chance of taking back the House from Republicans’ razor-thin majority. The GOP-controlled Senate was also in play: Democrats were taking aim at a broader-than-expected battlefield while also trying to fend off Republicans’ effort to flip blue seats.
The article also includes profiles of Journal graphics staff members Kara Dapena, Danny Dougherty, Chiqui Esteban and Rosie Ettenheim.
Kara Dapena is a graphics reporter at The Wall Street Journal in New York who covers stories across a variety of subjects and specializes in design, data visualization and data analysis. She joined the Journal in 2017 and has worked closely with investigations, politics, enterprise, corporate and world coverage. The profile says she was part of the Journal team that won the 2025 Pulitzer Prize in National Reporting for coverage of Elon Musk. Her role focuses on creating and helping the rest of the graphics team design and report visual journalism, both for rapid and longer-term turnaround projects. Before her current role, Dapena was graphics lead for Exchange, the Journal’s weekend business section. Before joining the Journal, she was data visualization editor at the Miami Herald, where she was part of the team that won the 2017 Pulitzer Prize in Explanatory Reporting for the Panama Papers series.
Danny Dougherty is a graphics reporter at The Wall Street Journal’s Washington bureau, working on visually driven stories about elections, politics, economics and science. He focuses on how new technologies change the way the Journal tells stories and has built tools to transform reporting with 3D graphics, interactive mapping and complex data. Before joining the graphics team, Dougherty came to The Wall Street Journal in 2016 as a data reporter. He has worked with reporters to analyze and contextualize data, specializing in coverage of economics, the pandemic and financial regulation.
Before the Journal, Dougherty worked as a data and graphics reporter at McClatchy Newspapers, Bloomberg, the Pew Center on the States, the Pew Research Center, U.S. News & World Report, the Columbia Missourian and the Maneater. He also worked on Pulitzer-winning Panama Papers reporting and Polk-winning coverage of China. He is a St. Louis native and a graduate of the University of Missouri-Columbia, where he majored in journalism and minored in art history and archeology.
Chiqui Esteban is The Wall Street Journal’s director of graphics in Washington, D.C. He previously worked at the Washington Post and the Boston Globe and served as deputy art, maps and graphics director at National Geographic.
Rosie Ettenheim is a graphics reporter at The Wall Street Journal in New York who specializes in data visualization and design. Her coverage spans politics, investigations and sports; she writes data-driven visual stories, works with reporters and editors across the newsroom and develops graphics for them. Before joining the Journal, Ettenheim worked primarily at environmental-focused non-profit organizations doing data visualization and graphic design. She is a graduate of Mount Holyoke College, Gallaudet University and the Maryland Institute College of Art.
The forecast combines categorical ratings for individual races, Senate thresholds for control and a reader-controlled display of the House and Senate split based on chosen race outcomes. The ratings come from three nonpartisan analysts, while the interactive lets readers view how their selections add up across the two chambers.